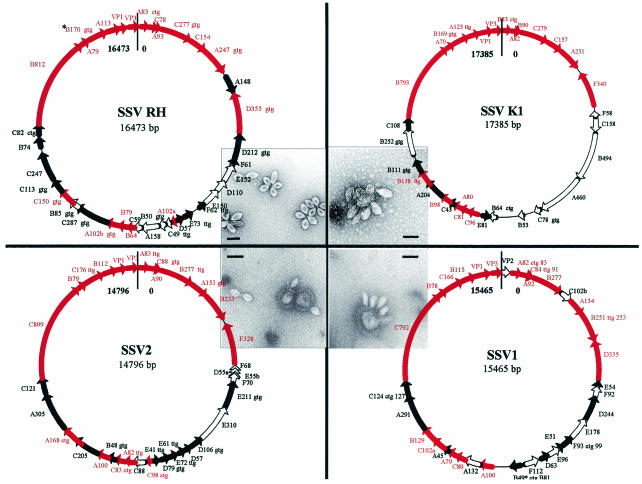
FIG. 1.
Genome maps of the four isolates. Conserved ORFs shared by all genomes are shown as red arrows. ORFs shared between two or three of the SSV genomes are shown as solid black arrows, and ORFs unique to each isolate are shown as open arrows. TEM images of each virus are positioned next to maps of their respective genome (bars, 100 nm) (3, 34). The alternative initiation codons (asterisks) are indicated directly following the name of each ORF in which they were identified.

