
Figure 1.
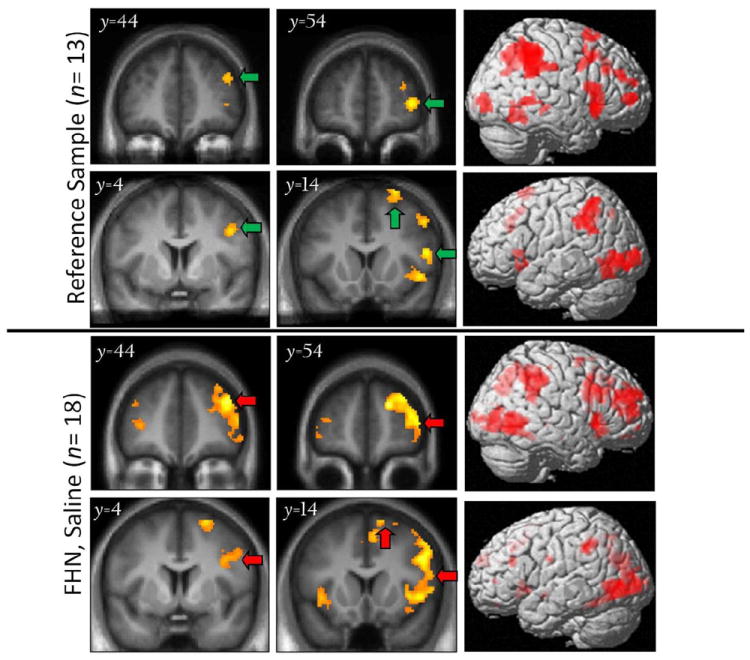
[Inh > Go] BOLD response in the reference sample (top) and in family history negative (FHN) subjects under placebo conditions (bottom), with 3D rendering of activation (right-most column). Note lateralized effects in right frontal cortex. Green arrows: Significant (pFWE< 0.05) clusters of BOLD responses at height threshold puncorr < 0.001. Red arrows: Clusters in FHN that correspond to (are replicated by) those of the reference group. Left = left in coronal slices.