
Figure 3.
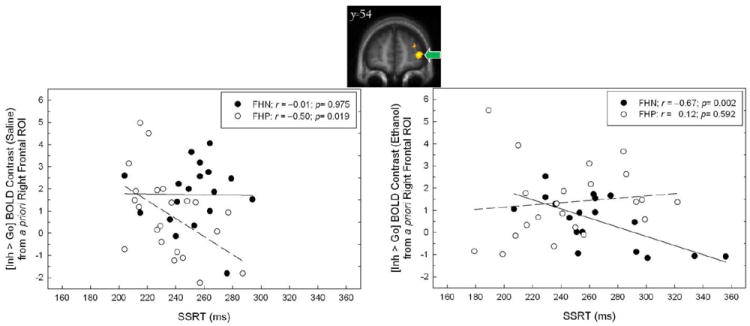
Relationship between stop signal reaction time (SSRT) and the BOLD contrast [Inh > Go] during alcohol and placebo (saline) infusion in the right prefrontal ROI derived from the reference group (voxel map, top; green arrow; also see Figure 1). Separate regression lines reflect trends for FHN (solid) and FHP (dashed).