
Figure 4.
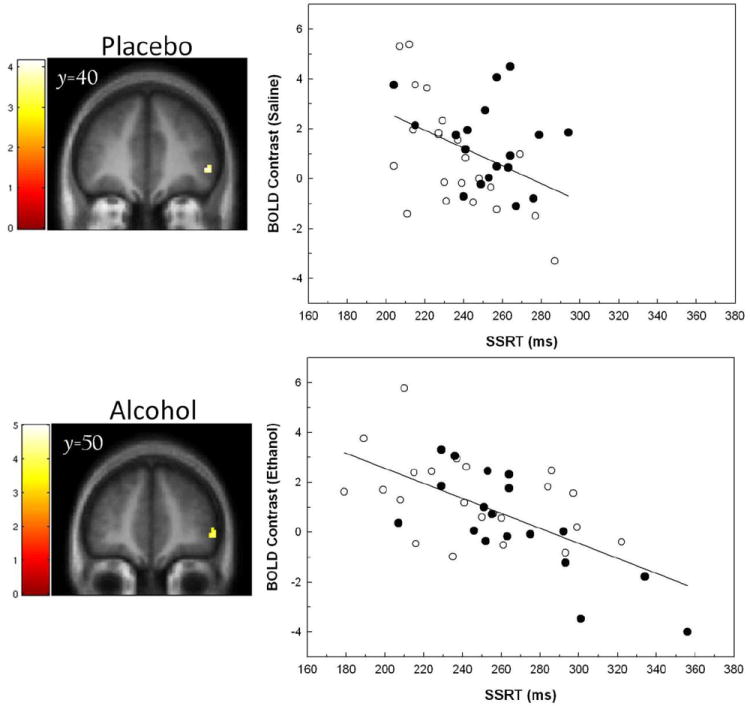
Left. Voxel-wise analyses of the relationship between SSRT and BOLD contrast [Inh > Go] during placebo (saline; top) and alcohol (bottom) infusion. Display threshold p< 0.001, k > 10 voxels, masked for the [Inh > Go] main effect in each of the respective infusions. Right. Plots that illustrate the relationships between SSRT and the BOLD contrast as extracted from the clusters displayed in the voxel-wise maps at left. Solid circles= FHN; Open circles= FHP.