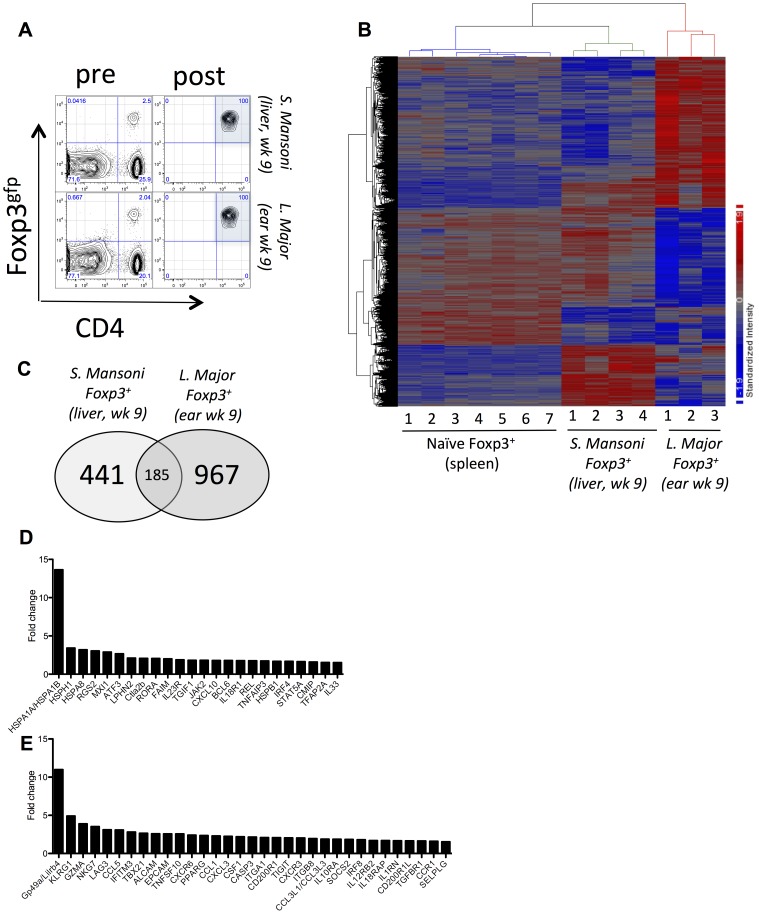
Figure 1. Differential gene expression in CD4+Foxp3+ cells isolated from chronic S. Mansoni or chronic L. Major infected tissue.
(A) Isolation and FACS sorting of CD4+Foxp3+ cells from the liver of S. Mansoni or ear of L. Major infected mice. (B) Heat map of differential gene expression showing biological replicates (naïve Treg = 7, S. m. Treg = 4, L. m. Treg = 3 biological replicates) for the isolated Foxp3+ populations. 3944 array probes were differentially expressed at a false discovery rate (FDR) less than 0.05. The list of 3944 array probes is provided in Table S1. (C) Number of common (overlap) and unique genes that were differentially regulated between the Sm-Foxp3+ cells and Lm Foxp3+ cells, relative to ‘Naïve’ Foxp3+ cells (FDR<0.1 and fold change >1.5). (D) Immunity-associated genes up-regulated in Lm Foxp3+ cells. (E) Immunity-associated genes up-regulated in and Sm Foxp3+ cells.

