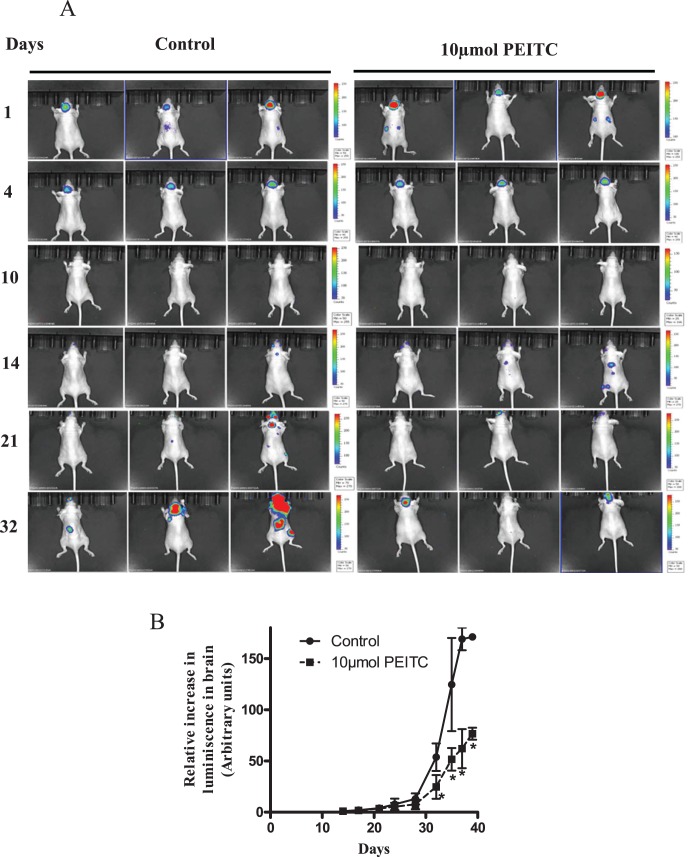
Figure 2. Growth suppression of tumor cells in brain.
(A) The MDA-MB-231 (BR) breast cancer cells that reach brain start developing tumors after 14th day of intra-cardiac injection. The PEITC (10 µmol by oral gavage) treatment started on 14th day of tumor cell implantation and mice were imaged periodically. Luminescence signal from brain was collected using IVIS in vivo animal imager. (B) Average luminescence after quantification of the signal from mice brain and plotted against time (days) to obtain tumor growth curve. The arbitrary units were used for luminescence intensity quantification. The change in signal intensity from each mouse brain was calculated relative to the initial signal observed on day 14. * P<0.05, statistically different when compared with control. Results are presented as mean ± SD of triplicates.

