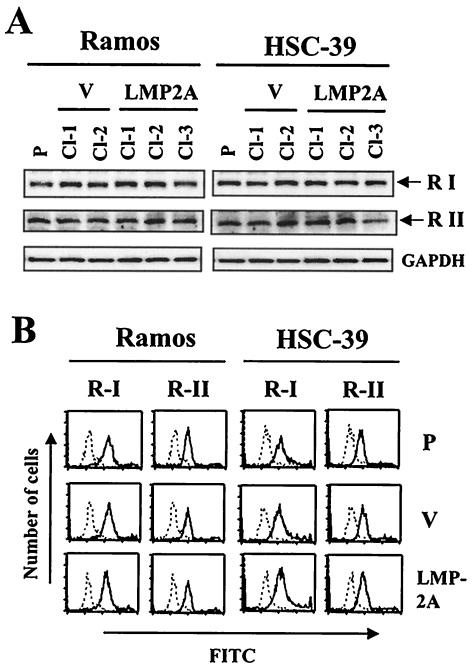
FIG. 3.
Determination of expression of TGF-β receptor type I and receptor type II in LMP2A-expressing Ramos and HSC-39 cells. (A) Immunoblot analysis. Parental (P), vector control (V), and LMP2A-expressing Ramos and HSC-39 cells were analyzed by immunoblotting. The positions of TGF-β receptor type I (53-kDa) (R I) and type II (70-kDa) (R II) bands are indicated at the right. The amount of protein loaded in each lane was assessed by rehybridization of the filter with a specific antibody for human glyceraldehyde-3-phosphate dehydrogenase (GAPDH). (B) Flow cytometric analysis. The broken line represents a negative control. The solid line represents cells stained with anti-TGF-β receptor type I or type II antibody and FITC-conjugated secondary antibody. The data are representative of three experiments.

