
Figure 3. IGF-1 overexpression increased hippocampal GFAP levels following brain trauma.
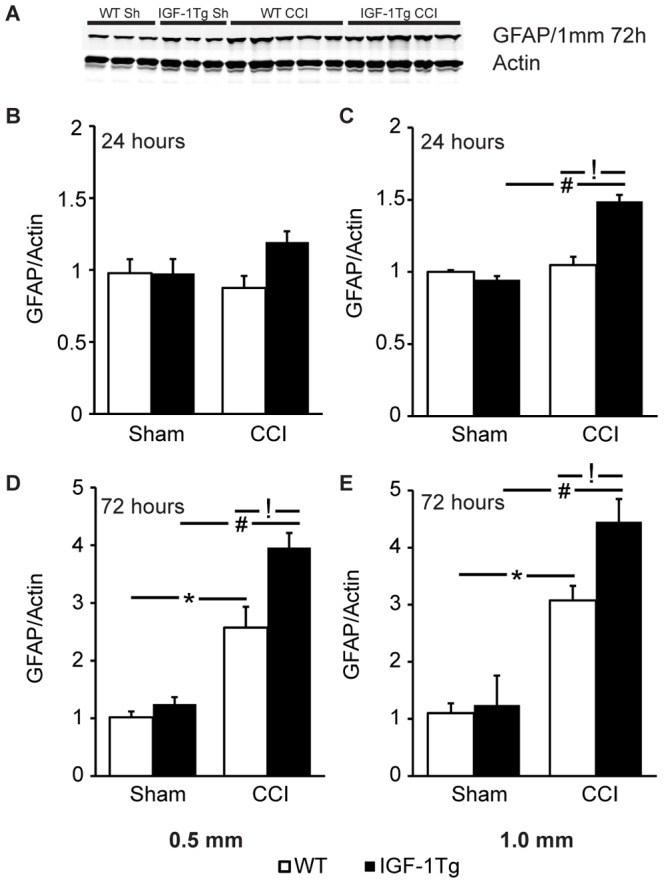
A) Representative western blot images for ipsilateral hippocampal samples probed with anti-GFAP and anti-actin antibodies. Blots illustrate expression at 72 h after severe controlled cortical impact (CCI) brain injury or sham injury (Sh). Relative expression of hippocampal GFAP at 24 h (B,C) and 72 h (D,E) following either 0.5 mm (B,D) or 1.0 mm (C,E) depth CCI in wildtype (WT, open bars) and IGF-1 transgenic (IGF-1Tg, closed bars) mice. Optical density from each band was normalised to its respective actin band and then group means were normalised to the mean of the WT sham group. Data represented as mean+SEM. * p<0.05 and # p<0.05 comparing CCI with sham, and ! p<0.05 comparing IGF-1Tg to WT.