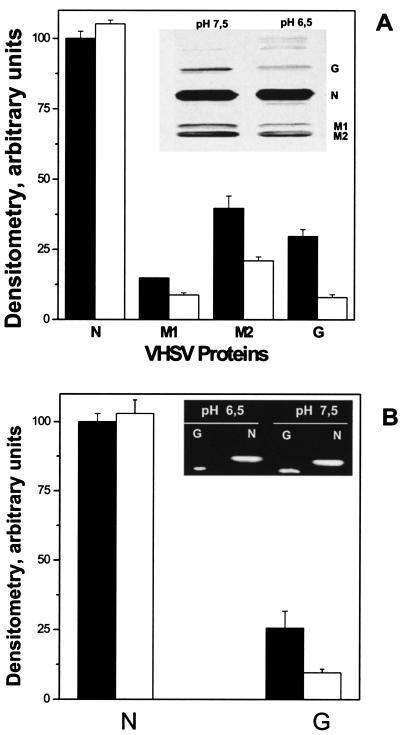
FIG. 5.
Western blotting analysis of N, M1, M2, and G proteins (A) and RT-PCR of G and N cDNAs (B) present in VHSV-infected cells at pH 7.5 or 6.5. (A) VHSV-infected EPC cell monolayers (MOI of 10) were harvested at 24 h postinfection, concentrated by centrifugation, lysed, and separated by polyacrylamide gel electrophoresis. After transfer to nitrocellulose membranes, they were treated with a PAb against VHSV. Inset, Western blotting of VHSV proteins at pH 6.5 and 7.5. Bands and Western blotting were measured with a densitometer, and the relative peak areas were calculated as the area under each protein band at each pH/area under protein N band at pH 7.5 × 100. Averages and standard deviations from two different experiments are given. White bars, densitometry of proteins at pH 6.5. Black bars, densitometry of proteins at pH 7.5. (B). An RT-PCR was performed with total RNA isolated from VHSV-infected EPC cells at pH 7.5 or 6.5 at 24 h postinfection. Inset, agarose gel of PCR products obtained by RT and amplification of the same amount of RNA, using specific primers for VHSV G and N proteins. cDNA quantification (arbitrary units) was performed by densitometry of the DNA bands in the agarose gel. Relative peak areas were calculated as the area under each cDNA band at each pH/area under cDNA from N at pH 7.5 × 100. Averages and standard deviations from two different experiments are given. White bars, densitometry of cDNAs at pH 6.5. Black bars, densitometry of cDNAs at pH 7.5.

