
Table 1.
Subjects' characteristics
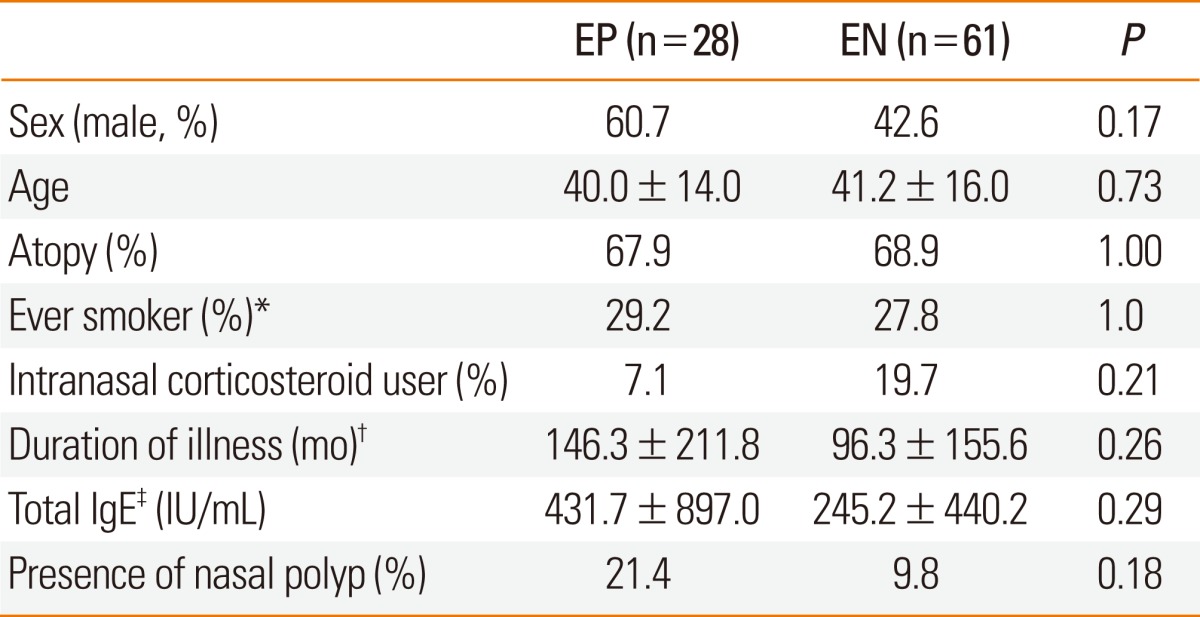
Values are means±standard deviations for continuous variables. Continuous variables were analyzed using the t-test and categorical variables using the χ2-test. *The total number of patients was 78 (24 in the EP group and 54 in the EN group). †The total number of patients was 77 (21 in the EP group and 56 in the EN group). ‡The total number of patients was 61 (25 in the EP group and 36 in the EN group). EP, eosinophilia-positive group; EN, eosinophilia-negative group.