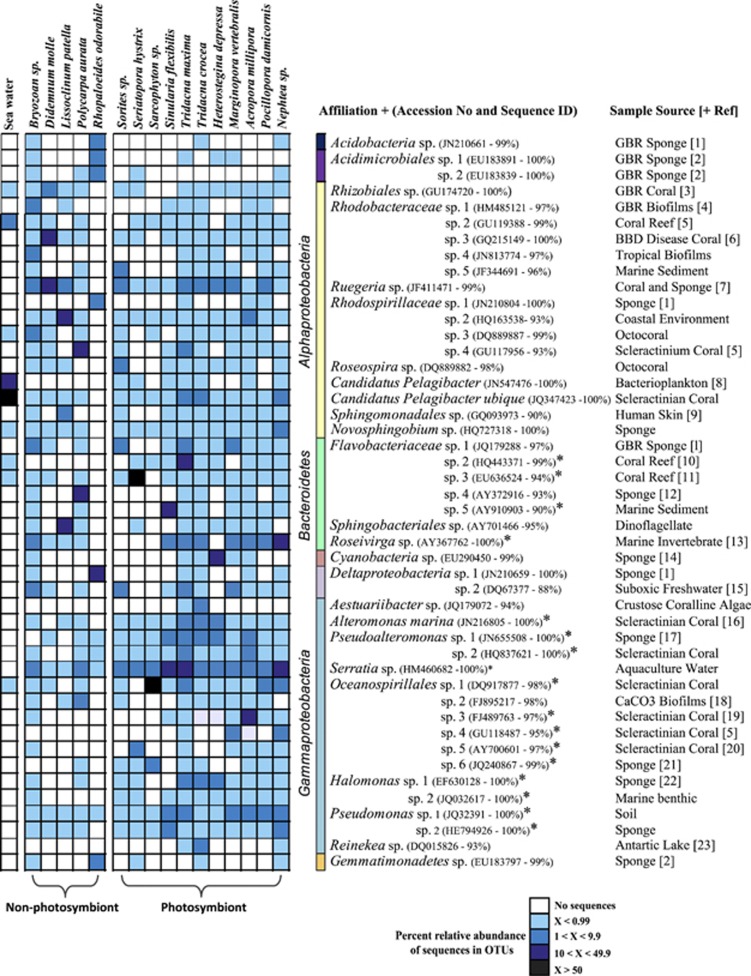
Figure 2.
Heatmap of OTUs (97% sequence identity, averaged within each invertebrate species) that represent >5% of sequence tags within a particular sample type or represented an OTU with a significant indicator value (representative of high relative abundance and high relative frequency of occurrence in photosymbiont-bearing invertebrates). OTUs with highest indicator values are represented by an asterisk (*). The closest sequence match determined in a BLAST database query (Altschul et al., 1997) and its corresponding accession number and derived sample source are also represented. If these affiliated sequences are represented in a published study the associated reference can be found in Supplementary References.

