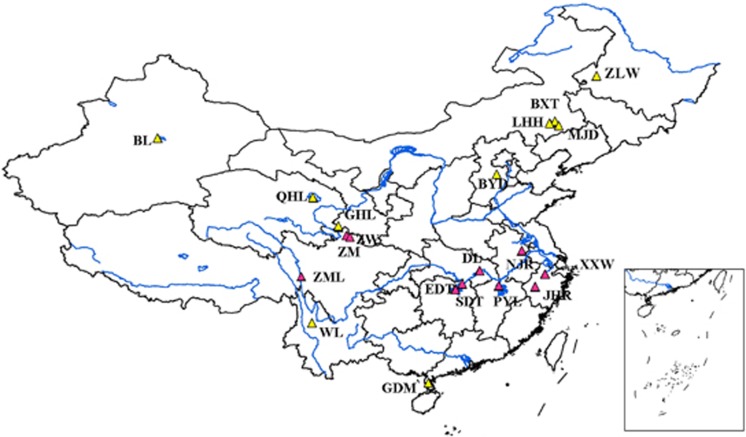
Figure 1.
Geographic distribution of the wetland sites. Codes on the map are described in detail in Table 1. Pink triangles represent the sampling areas along the Changjiang River and yellow triangles represent wetlands at other sites in China. A full color version of this figure is available at the ISME Journal online.

