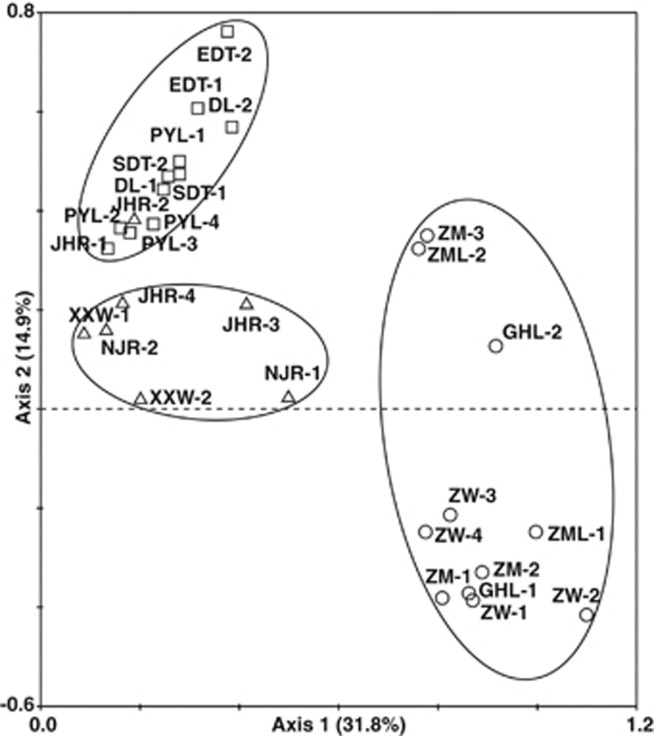
Figure 2.
PCA analysis based on DGGE profiles of the fungal communities along the Changjiang River. Each point indicates a sampling area in wetlands. Distances between any two points on the graph indicate the ecological distance between the community compositions. Numbers within parentheses are the percentage variance explained by each principal component. Circles, squares and triangles indicate samples from upstream, midstream and downstream locations, respectively, along the Changjiang River.

