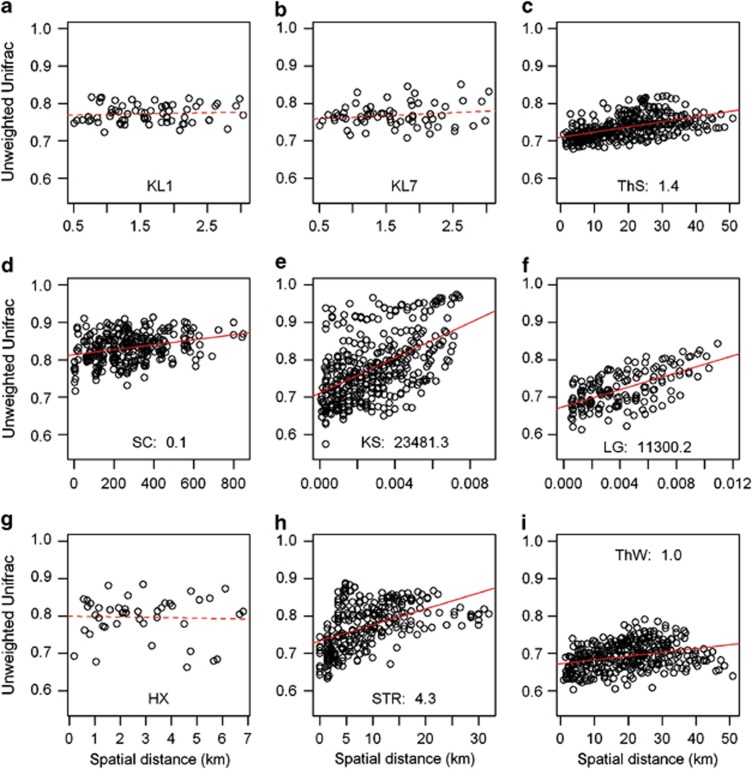
Figure 3.
The relationships between unweighted Unifrac and spatial distance for different sample groups. (a–d) Lake surface sediments; (e, f) lake subsurface sediments; (g) soils; (h) stream biofilm and (i) lake water. The regression slopes of the linear relationships based on Gaussian generalized model are shown with solid (statistically significant, ranked Mantel test, 9999 permutations, P<0.05) or dashed (statistically nonsignificant, P>0.05) lines. The significant slope (unweighted Unifrac per 103 km) is shown in each sample group panel. Detailed Mantel statistics are shown in Supplementary Table S1.

