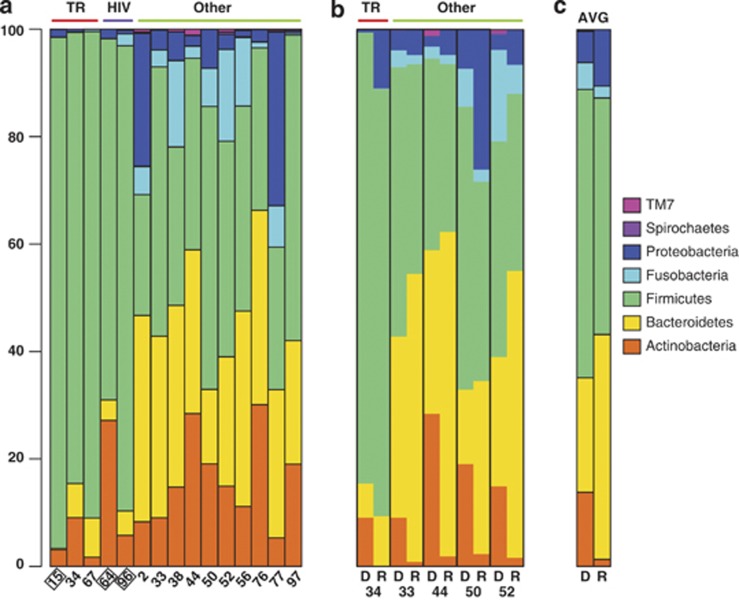
Figure 2.
Relative gastric fluid microbiota compositions at the phylum level. (a) Comparison of 15 HC 16S rRNA gene samples. (b) Comparison of 16S rRNA gene and transcript samples in five HC pairs. (c) Average compositions of 16S rRNA gene and transcript samples. Samples from antibiotic-treated patients are boxed. AVG, average; D, 16S rRNA gene amplicon data; HIV, HIV/AIDS patients; R, 16S rRNA transcript data; TR, transplant recipient.

