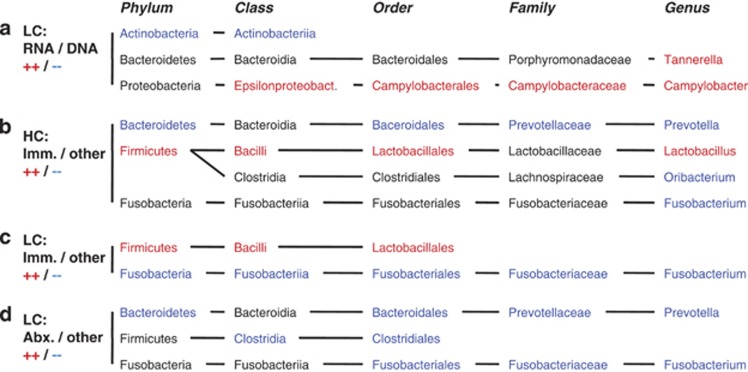
Figure 4.
Microbiota components with significantly different relative abundance between groups. (a) LC samples: Comparison of 16S rRNA gene-based and rRNA transcript-based microbiota; (b) HC Samples: Comparison of immunocompromised (transplant recipients and HIV/AIDS patients) and other patient samples; (c) LC samples: Comparison of immunocompromised (transplant recipients and HIV/AIDS patients) and other patient samples; (d) LC samples: Comparison of antibiotic-treated and other patient samples; Significant differences were calculated on five taxonomic levels (phylum, class, order, family, genus) using Metastats (White et al., 2009) with a P-value threshold of 0.003, based on the taxonomic assignments of all reads with the RDP Bayesian classifier (Wang et al., 2007). Taxa with significantly greater relative abundance in the first compared with the second group of samples are shown in red, those with lower abundance in blue, and those without significant difference in black. Only taxonomic lineages that contain at least one component of significantly different relative abundance between the compared groups are shown.

