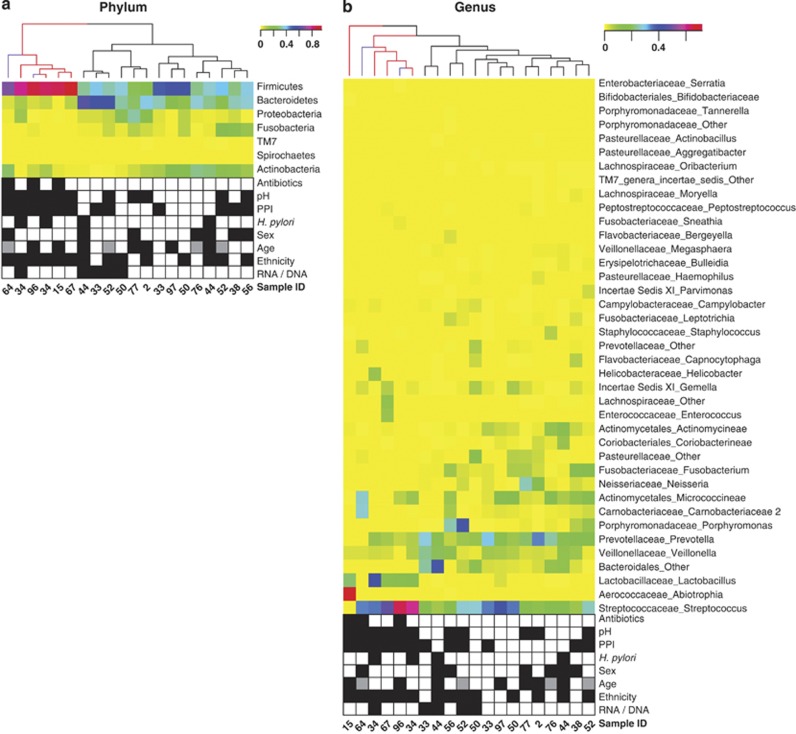
Figure 5.
Hierarchical clustering of HC 16S rRNA gene and transcript samples based on microbiota compositions. (a) Phylum level; (b) Genus level. Colors (yellow to red) show relative abundance per sample. Branches of the tree showing sample similarities based on hierarchical clustering are colored for transplant recipients (red) and HIV/AIDS patients (purple). Rows are also clustered hierarchically based on similar relative abundance values across samples (dendrogram not shown). Patient sample metadata are shown using checkerboard plots based on the following color codes: Antibiotic treatment (black) or no treatment (white) within 3 months before sample collection; high pH 4.0–8.5 (black) or low pH 1.0–4.0 (white); PPI treatment (black) or no treatment (white) within 24 h of sample collection; H. pylori presence (black) or absence (white) based on 16S rRNA gene amplicon sequencing; male (black) or female (white) sex; ethnicity: African American (black) or Caucasian (white); RNA/DNA: 16S rRNA transcript (black) or 16S rRNA gene (white) data. For age, black, gray and white boxes refer to 27–38, 42–56 and 65–81 years, respectively. See Table 1 for additional details.

