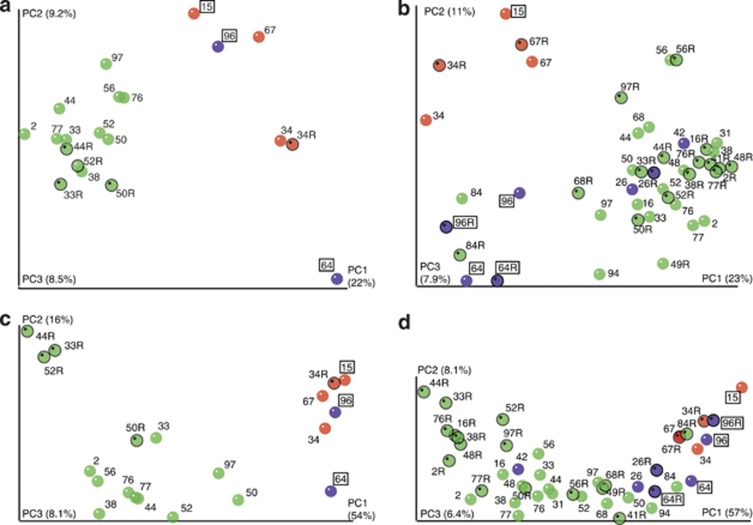
Figure 6.
Unscaled principal coordinate analysis (PCoA) plots showing unweighted (a, b) and weighted (c, d) UniFrac analysis of HC (a, c) and LC (b, d) samples. Samples are color coded as follows: Transplant recipient (red), HIV/AIDS patient (purple) or other (green) samples. 16S rRNA transcript data are marked with an ‘R' after the patient number and outlined in black. Antibiotically treated patient samples are boxed.

