
Fig. 1.
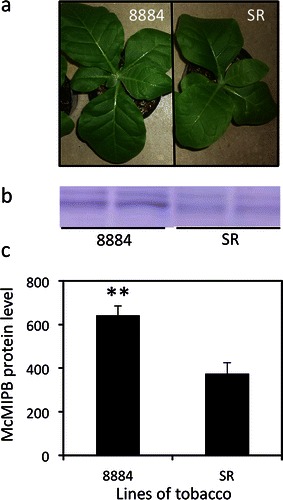
Images of whole plant and protein levels of aquaporins detected by the McMIPB antibody (McMIPB). a Images of lines 8884 and SR grown for 1 month after seeding, b levels of McMIPB, and c intensity of McMIPB protein levels that were densitometrically quantified by Western analysis, where values are mean ± SE from different plants (n = 3–5). Statistical analysis was done using an unpaired t test. Asterisks above bars indicate that the means of transgenic plants are significantly different from the SR line (p < 0.01)