
Fig. 7.
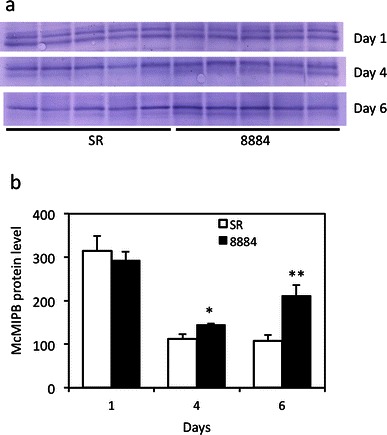
McMIPB protein levels of tobacco leaves grown under progressing soil water deficits. a McMIPB protein level and b intensity of McMIPB protein levels that were densitometrically quantified by Western analysis, where values are mean ± SE from five different plants (n = 5). Statistical analysis was done using an unpaired t test. Asterisks above bars indicate that the means of transgenic plants are significantly different from the SR line on the same day (*p < 0.05, **p < 0.01)