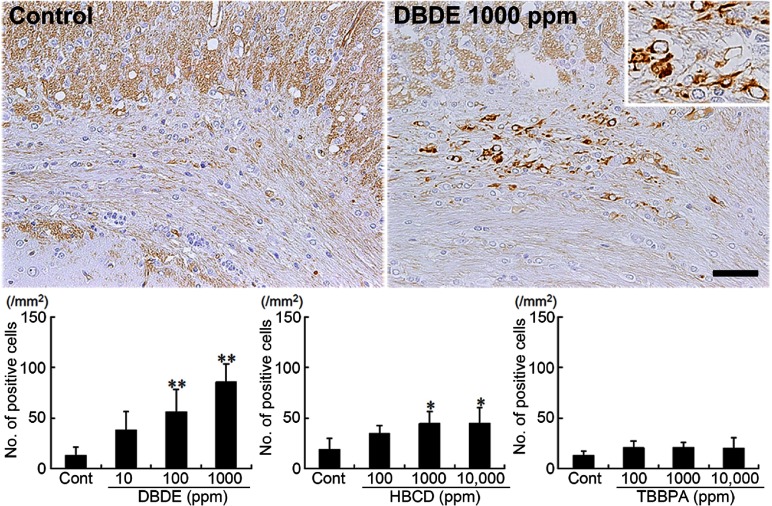
Fig. 3.
Immunohistochemical distributions of vimentin+ cells in the white matter tissue of BFR-exposed offspring. Untreated control animal (left) and 1000 ppm DBDE-exposed animal (right). 200× magnification (inset: 400× magnification). Bar = 50 μm. Graph shows the mean number of positive cells within the cingulum at 100× magnification (n = 5/group). Values are expressed as means + SD. * P < 0.05 vs. untreated controls, ** P < 0.01 vs. untreated controls.

