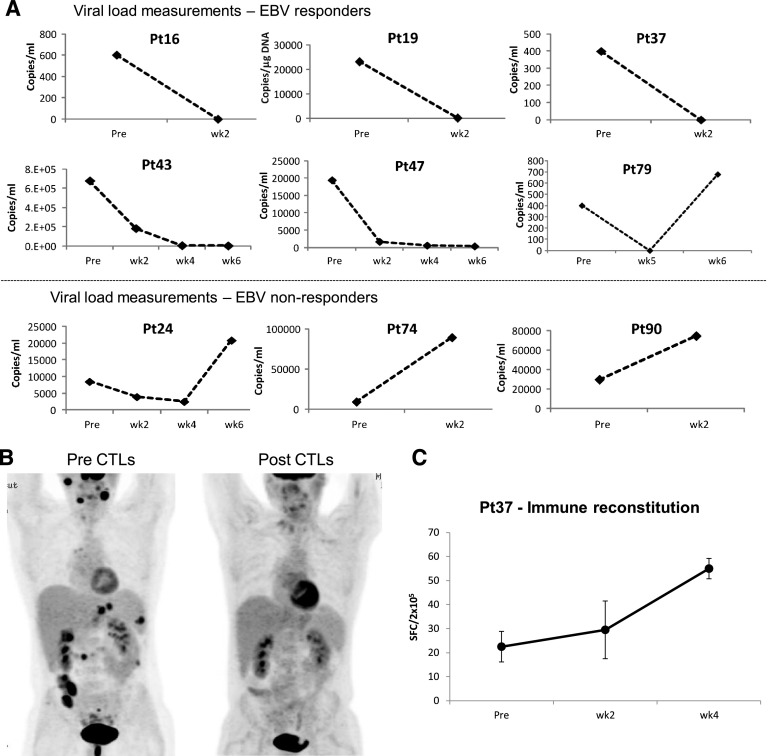
Figure 4.
Outcomes after treatment with banked VSTs: EBV-infected patients. (A) Serial viral load measurements before and during 6 weeks post-VST infusion in patients (responders and nonresponders) with EBV-LPD. Results are presented as copies per milliliter. (B, left) Positron emission tomography scan of a patient with extensive and progressive LPD despite sirolimus therapy, with a second scan (right) showing complete resolution of all lesions after VST infusion. (C) Frequency of EBV-directed T cells in peripheral blood before and at weeks 1, 2, and 4 postinfusion, as measured with an IFN-γ ELIspot assay after overnight stimulation of PBMCs with EBV lymphoblastoid cell lines. Results are expressed as mean (±SD) SFC per 2 × 10⁵ input cells.

