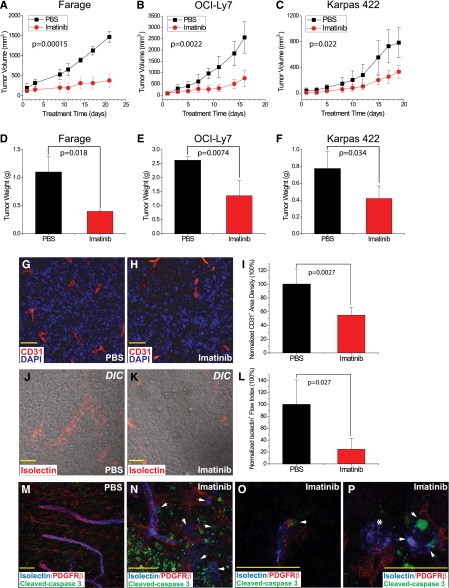
Figure 1.
Imatinib impaired growth of human lymphoma xenografts by disruption of tumor-associated microvasculature. (A-C) Tumor growth curves based on tumor volumes (mm3), comparing imatinib mesylate treatment (red) vs PBS control (black). (D-F) Tumor weight (g) at the time of tissue harvest, comparing imatinib (red) vs PBS (black). (G-I) Microvessels delineated by CD31 stain (red) in (G) PBS- and (H) imatinib-treated tumors, and (I) microvessel density normalized to PBS control. (J-L) Confocal DIC capture of functional vascular flow measured by isolectin (red) and normalized to PBS control. (M-P) Confocal analysis of pericyte marker staining in tumors. Blue marks functional vascular flow measured by isolectin, red outlines PDGFRβ+ pericytes, and green shows cleaved caspase 3 in apoptotic cells. (M) PBS-treated tumor. (N) Imatinib-treated tumor, which displays microvascular disintegration and flow leakage (white arrows), and patchy areas of tumor apoptosis/necrosis. (O) White arrows indicate apoptotic, yet structurally intact, PDGFRβ+ cells in close proximity to functional flow. (P) White arrows mark apoptosis of isolectin+ endothelial cells, and white asterisk (*) indicates leakage of infused intravascular isolectin. Scale bar, 50 μm.

