Figure 5.
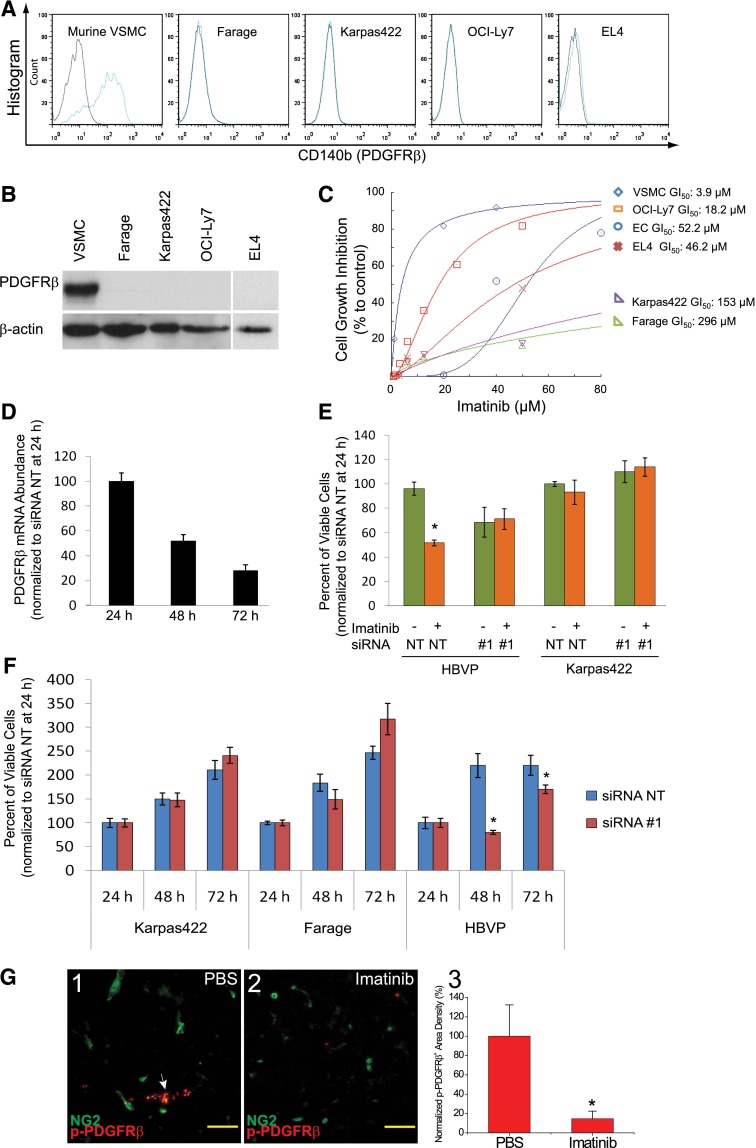
Imatinib inhibited PDGFRβ signaling in vascular mural cells. (A) FACS analysis of PDGFRβ expression in VSMC and lymphoma cells. (B) Immunoblot analysis of PDGFRβ protein expression in stromal and lymphoma cells. (C) Imatinib-mediated growth inhibition in VSMC, endothelial cells, and lymphoma cells. (D) Relative abundance of PDGFRβ mRNA at 24, 48, and 72 hours following transfection of siRNA #1 targeting PDGFRβ in HBVPs, and expressed as the percentage normalized to expression level at 24 hours after transfection. (E) Viable cell counts at 48 hours after treatment with imatinib (20 μM for HBVP, 50 μM for Karpas422), following transfection with siRNA for 24 hours in HBVPs and Karpas422 cells. All cell counts were normalized to values at 24 hours after siRNA transfection. (F) Viable cell counts at 24, 48, and 72 hours after transfection of siRNA nontargeting (NT) or PDGFRβ-directed siRNA #1 in HBVPs, Karpas422, and Farage DLBCL cell lines, and normalized to the values at 24 hours after transfection. Data are representative of triplicate experiments in C-F. (G) Immunostaining for phospho-PDGFRβ in NG2+ pericytes in Karpas422 tumors treated with either (1) PBS or (2) imatinib. White arrow indicates expression of phospho-PDGFRβ in NG2+ pericytes. (3) PDGFRβ signaling was quantified as phospho-PDGFRβ+ area and normalized to PBS control. *P < .05 compared with control. Scale bar, 50 μm.

