Figure 3.
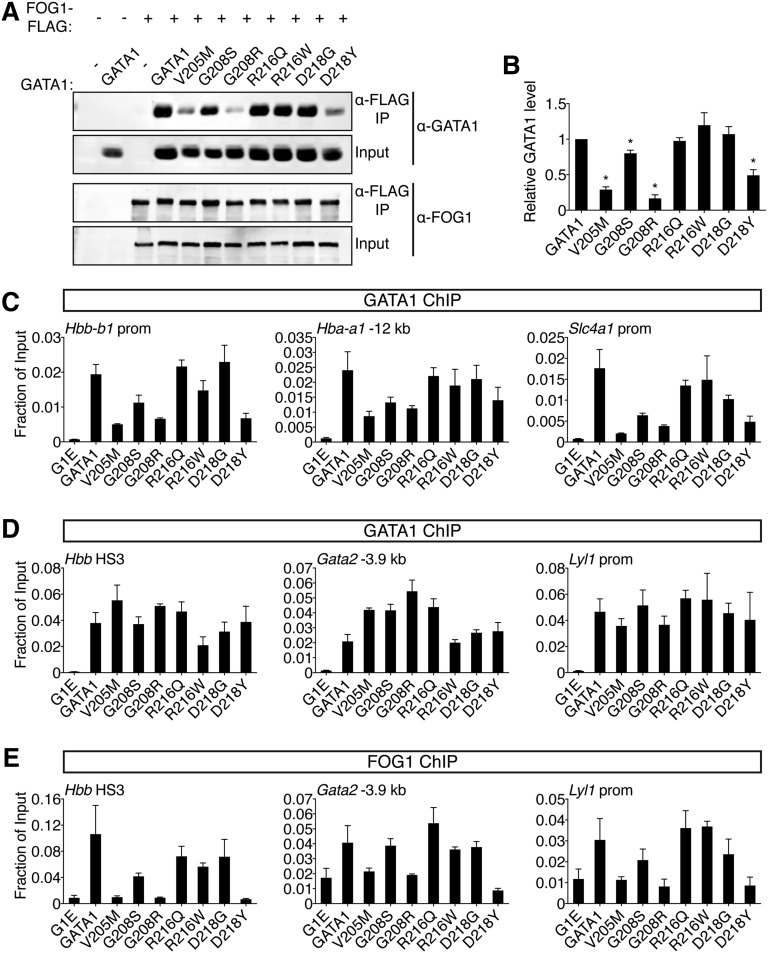
Comparative analysis of GATA1 mutations on FOG1 binding. (A) Wild-type or mutant GATA1 was coexpressed with FLAG-tagged FOG1 in HEK-293 cells and analyzed by anti-FLAG IP followed by anti-GATA1 or anti-FOG1 western blotting. Input represents 5% of lysate. (B) Quantification of western blot signals. (C-D) Anti-GATA1 ChIP in G1E cells expressing indicated GATA1 versions after 24 hours of E2 treatment. (C) FOG1-dependent binding sites and (D) FOG1-independent binding sites that contain single (Hbb HS3, Gata2 -3.9 kb) or palindromic (Lyl1 prom) motifs and regulate activated (Hbb) or repressed (Gata2, Lyl1) genes. (E) Anti-FOG1 ChIP at FOG1-independent GATA1 binding sites. *P < .05. All error bars denote SEM (n = 3).

