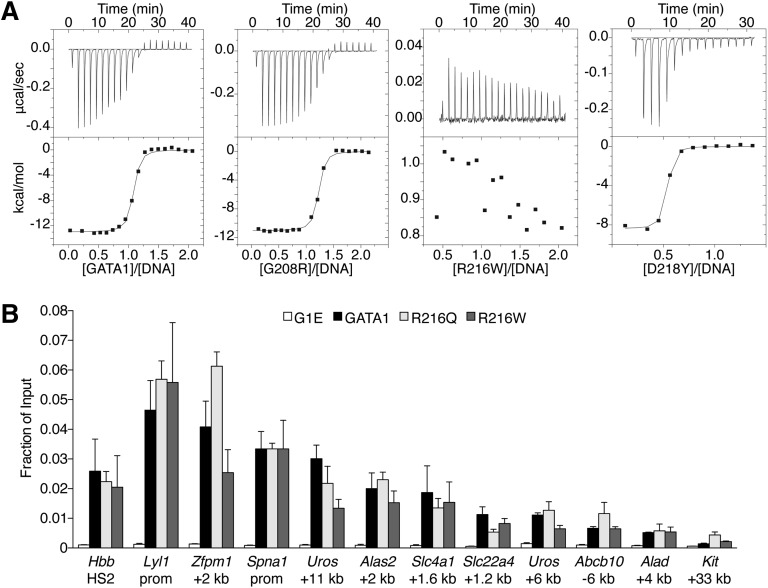
Figure 4.
Analysis of GATA1 mutations for DNA binding. (A) ITC data showing the titration of wild-type or indicated mutant versions of the GATA1 NF into a 16-bp oligonucleotide containing a GATC motif. (B) Anti-GATA1 ChIP in G1E cells expressing wild-type or mutant GATA1 after 24 hours of E2 treatment using primers spanning single (Hbb HS2) or palindromic (all others) motifs. All error bars denote SEM (n = 3).

