Figure 1.
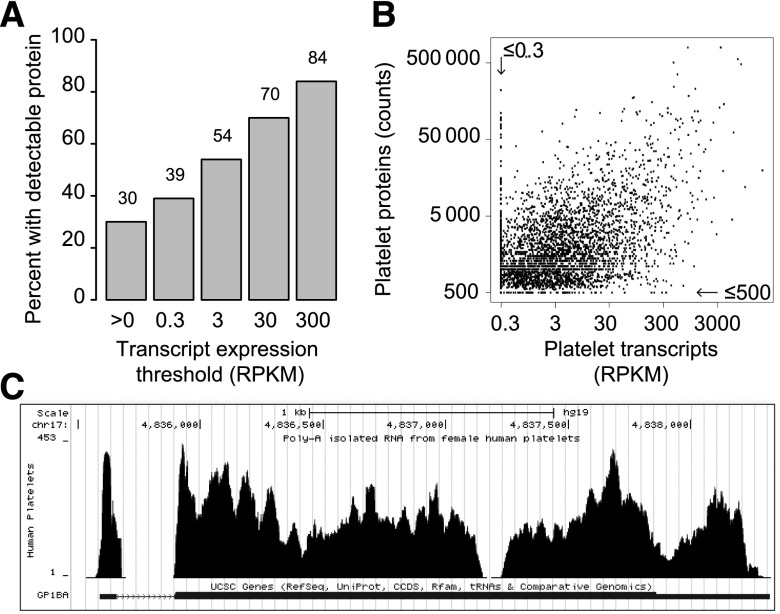
Transcript and protein expression in platelets is correlated. (A) The percentage of transcripts where the coordinate protein is detected is plotted for each threshold of transcript expression. (B) Scatter plot comparing log-adjusted transcript expression (x-axis) with log-adjusted protein expression (y-axis) for all proteins with an ID match to a transcript. For visual simplicity, transcripts or proteins below the arbitrary background threshold (0.3 RPKM or 500 count, respectively) were adjusted to the threshold. Values were left unadjusted for the correlation analysis described in the text. (C) Visualization of our RNA-seq data for GPIbα in the UCSC genome browser (http://genome.ucsc.edu) via direct links in GNomEx (https://bioserver.hci.utah.edu/gnomex/). To view the data, sign in as a guest, type “platelet” in the search box, double click on the track of interest, and then click the University of California Santa Cruz browser link next to the data track title.

