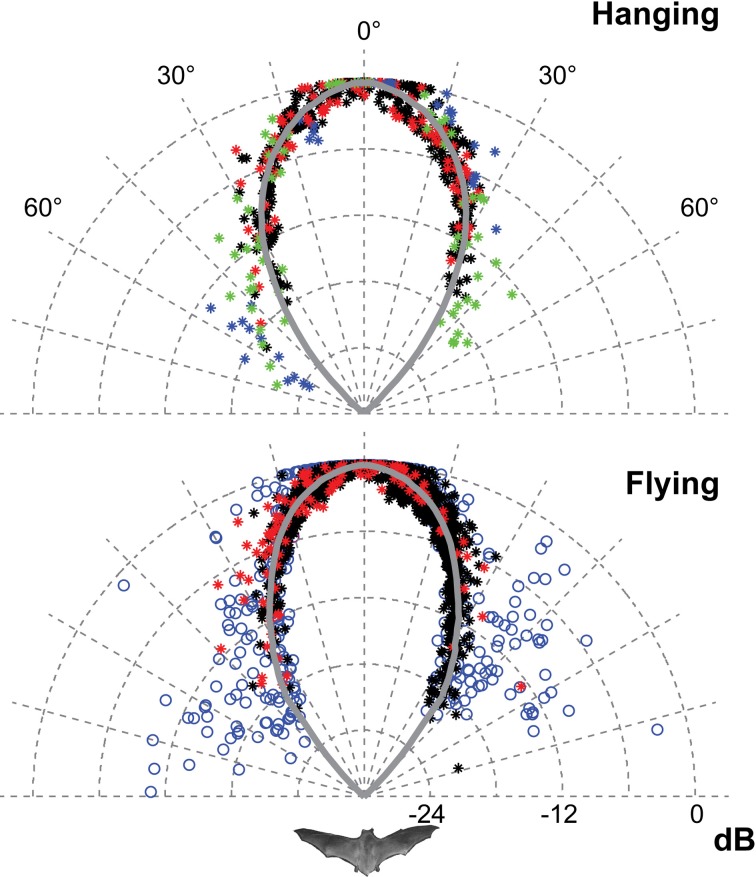
Figure 3.
The horizontal directionality when flying and hanging. The data for hanging bats are from 2012 (red and black) and from 2008 (blue and green). The data for flying bats are from 2012 (red and black) and from 2006 (blue). Each point is the normalised amplitude in that direction. The curves are the average of the measured values pooled in 1° bins and extrapolated using a fitted second order polynomial. Only data from 2012 was used for the traces and DI estimates because of the higher degree of control of beam aim. The sonar beam is very directional, both when flying and hanging. HAM was 18°.

