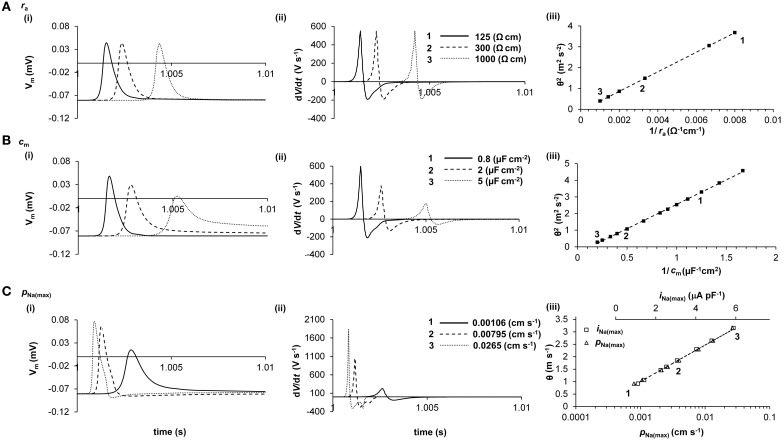
Figure 2.
Quantification of the determination of θ in a computer model. The cable equation identifies ra, cm, and ii as the determinants of θ, but does not clearly demonstrate the magnitudes of their influences. Computer modeling of a skeletal muscle fiber (Fraser et al., 2011) shows the influence of ra (panel A), cm (panel B), and iNa(max) (panel C) on AP waveform (i), dV/dt (ii), and θ (iii). In panels i and ii, three representative APs are shown, each stimulated at 1s and recorded 2.5 mm further along the cable, such that increased times to the AP peaks denote slowed conduction. In panel iii, the velocities of these APs are labeled 1, 2, and 3. It will be noted that ra influences θ but not AP waveform, whereas cm and iNa(max) each influence AP waveform and θ. Note that in panel C(iii), θ is plotted against both iNa(max) (upper scale, squares) and PNa(max) (lower scale, triangles). The simple quantitative relationships between these parameters that emerge from this analysis are given in the text.

