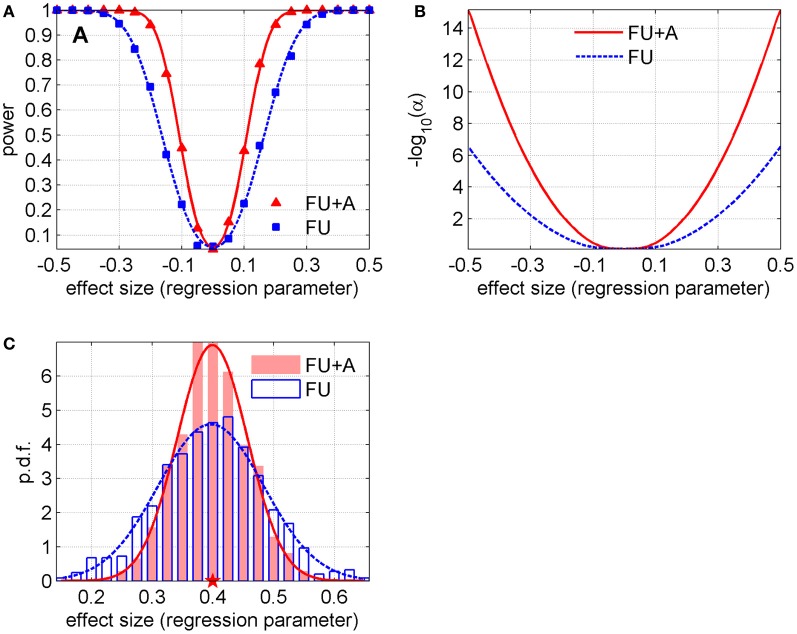
Figure 1.
(A) Power in two methods described in the text (with follow-up only, “FU,” and follow-up and ages at biospecimen collection, “FU + A”) for different effect sizes (i.e., values of the regression parameter γ) and fixed α = 0.05; the lines denote the fit of the empirical curves by the power curves of a one-sample Z-test of the mean (the standard deviations that produced the best fit are 0.056 for “FU + A” and 0.084 for “FU”). (B) The level of the test [shown as − log10(α) for better visibility] that yields power w = 0.8, as a function of the effect size in both methods (the curves are calculated using the abovementioned values of standard deviations). (C) Example of distributions of the estimates of the regression parameter (shown by histograms) for the scenario with γ = 0.4 in both methods. The lines show their fits by normal distributions (the Shapiro-Wilk p-values are 0.34 and 0.64 for “FU” and “FU + A,” respectively). The pentagram denotes the true value of the regression parameter.

