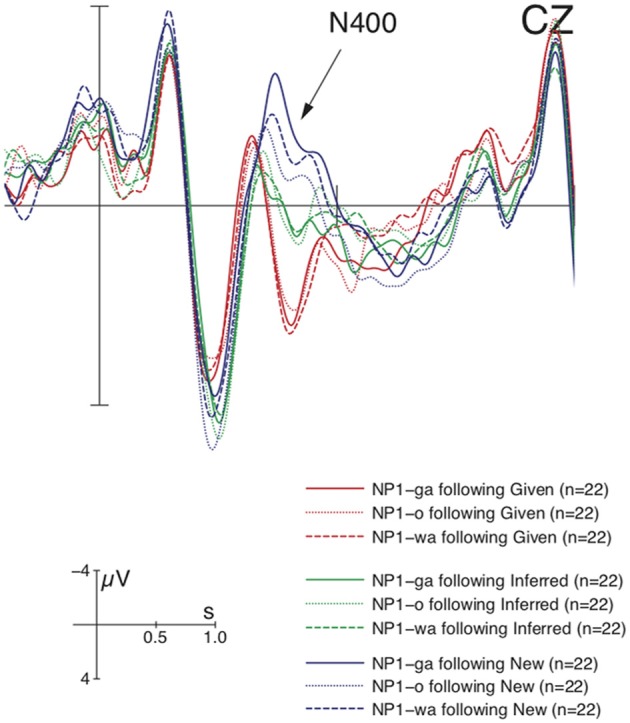
Figure 5.

Grand average ERPs (n = 22) time-locked to NP1 in Experiment 2 (onset at the vertical bar) for the comparison of ga vs. o vs. wa in the Given, Inferred, Contrastive New contexts. Only the NP1 in the new context engendered a marker-modulated N400 in comparison with the other two contexts. Negativity is plotted upwards.
