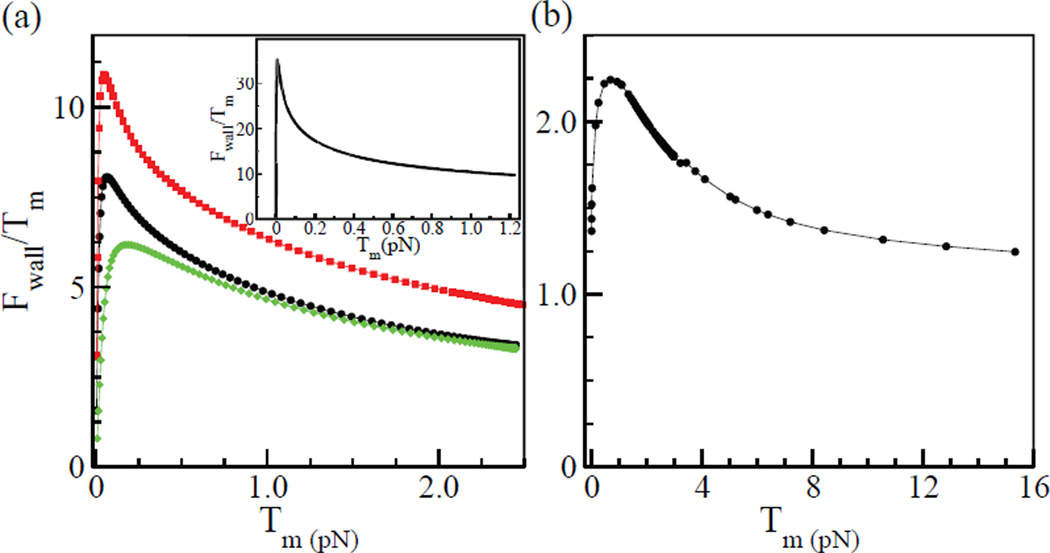
Figure 8.
a) Variation of Fwall/Tm with Tm for geometry of Fig. 7b. Black curve (dots): κ = 0.06 pNµm2 and µ = 600 pN. Red curve (squares): κ = 0.06 pN µm2 and µ = 1200 pN. Green curve (diamonds): κ = 0.12 pN µm2 and µ = 600 pN. Inset shows theoretical prediction for for geometry of Fig. 7a as calculated in the Supporting Material. b) Variation of Fwall/Tm with Tm for a sample thick bundle with a single mini-filament.

