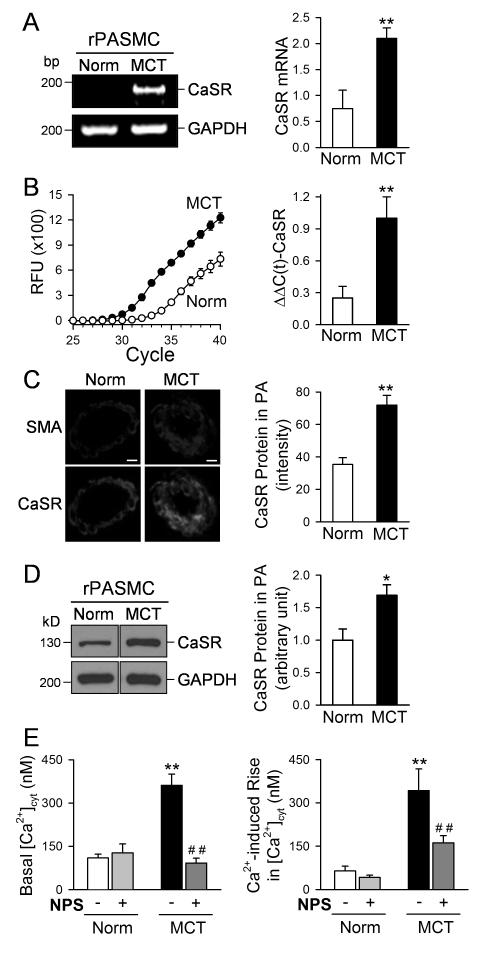
Figure 6. Upregulation of CaSR in PASMC from rats with MCT-induced pulmonary hypertension.
A and B. Regular (A) and real-timer (B) RT-PCR analyses on CaSR in PASMC isolated from normal rats (Norm, n=6) and rats with MCT-induced pulmonary hypertension (MCT, n=5). **P<0.01 vs. Norm. C. Immunohistochemistry data showing CaSR expression level (green fluorescence intensity) in normal and MCT-treated rats. D. Western blot analysis on CaSR in PASMC isolated from normal and MCT-PH rats. *P<0.05, **P<0.01 vs. Norm. E. Summarized data (means±SE) showing the basal [Ca2+]cyt (left panel, n=12) and the amplitude of extracellular Ca2+-induced [Ca2+]cyt increases (right panel, n=11) in PASMC freshly isolated from normal rats and MCT-injected rats that are treated with vehicle (−NPS) or 10 μM NPS 2143 (+NPS), a synthetic calcilytic. **P<0.01 vs. Norm (−/+NPS).

