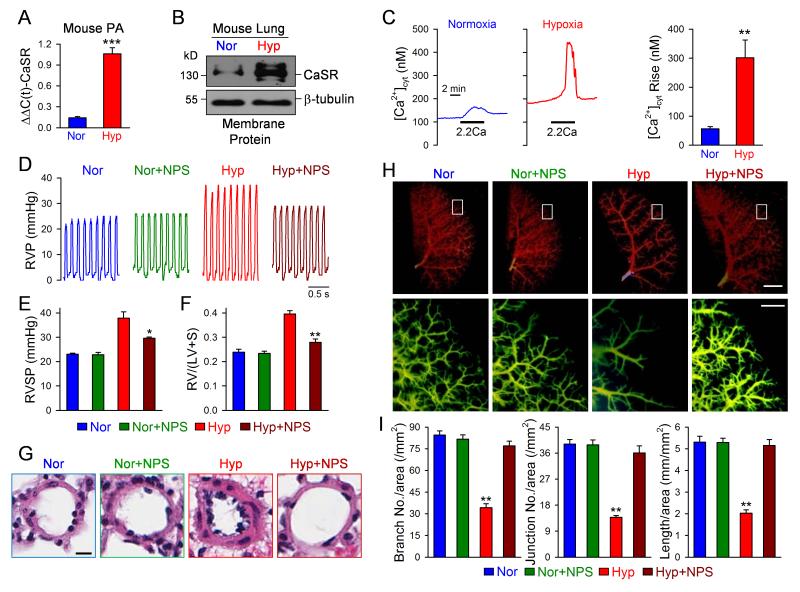
Figure 8. Upregulation of CaSR in PASMC from HPH mice and blockade of CaSR by NPS 2143 inhibits the development of HPH in mice.
A and B. Real-time RT-PCR (A) and Western blot (B) analyses on CaSR in PA and lung tissues isolated from normoxic (Nor) and hypoxic (Hyp) mice. C. Representative record (left panels) and summarized data (means±SE, right panel) showing the extracellular Ca2+-induced increase in [Ca2+]cyt in PASMC isolated from normoxic and hypoxic mice. **P<0.01, ***P<0.001 vs. Nor. D and E. Representative record of right ventricular pressure (RVP, D) and summarized data (means±SE) showing the peak value of right ventricular systolic pressure (RVSP, E) in normoxic (Nor, n=6) and hypoxic (Hyp, n=6) mice that are treated with vehicle or NPS 2143 (+NPS, 1 mg/kg once a day). F. Averaged Fulton index [RV/(LV+S) ratio, means±SE] in normoxic and hypoxic mice treated with or without NPS 2143. *P<0.05 vs. Hyp along. G. Representative H&E images of small pulmonary arteries showing that the medial thickness is significantly increased in Hyp mice and the hypoxia-induced medial hypertrophy is inhibited by NPS 2143. H. Representative angiography of the whole lung (upper panels) and enlarged area of the whole lung (lower panels, indicated by the box in the upper panels) in normoxic and hypoxic mice treated with vehicle or NPS (+NPS). The vertical bars denote 2 mm (upper panels) and 0.5 mm (lower panels). I. Summarized data (means±SE) showing the number of branches, the number of junctions, and the total length of vascular segments per square millimeter (mm2). **P<0.01 vs. other bars.

