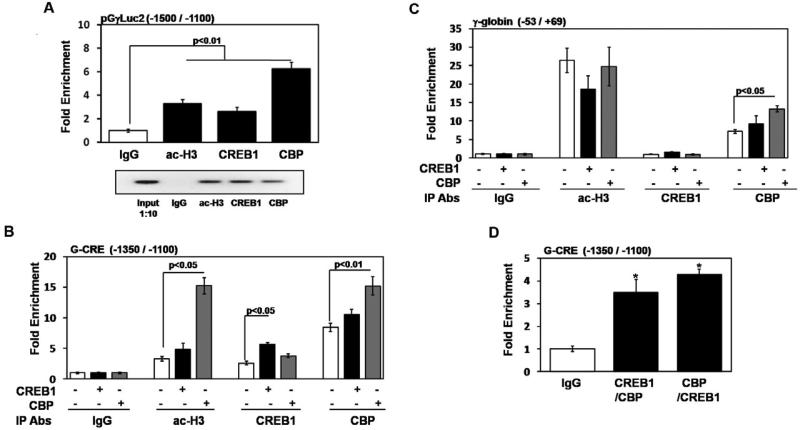
Fig. 7.
CREB1 and CBP co-localize to the G-CRE region in vivo. (A) ChIP assays were performed in the KGγLuc2 stable line with CREB1, CBP, acetylated histone H3 (ac-H3) and IgG antibodies; chromatin enrichment was normalized to IgG. qPCR analysis was performed using primers unique to the pGγLuc2 construct or endogenous G-CRE regions (Table 1). Data was calculated as the mean ± SEM; p<0.05 was considered significant. Shown in the agarose gel is PCR products of representative samples from each ChIP assay condition; 1:10 diluted input DNA was used as a control. (B) ChIP assays were performed using the KGγLuc2 stable line after CREB1 or CBP enforced expression; untreated cells were used as a control. The antibodies (Abs) used for the different immunoprecipitation (IP) reactions are shown in the graph. For each condition the presence (+) or absence (-) of the various constructs is shown. qPCR analysis was performed using primers specific to the endogenous G-CRE region (Table 1); chromatin enrichment is represented as fold change relative to IgG. (C) For the same chromatin described in Fig.7B, qPCR analysis was also performed using proximal γ-globin promoter primers as a control (Table 1). (D) Sequential ChIP assay was performed in the KGγLuc2 stable line (see “Experimental procedures”). Experiments were performed with CREB1 antibody followed by CBP and vice versa. Enrichment obtained after sequential ChIP was normalized relative to values obtained for IgG.

