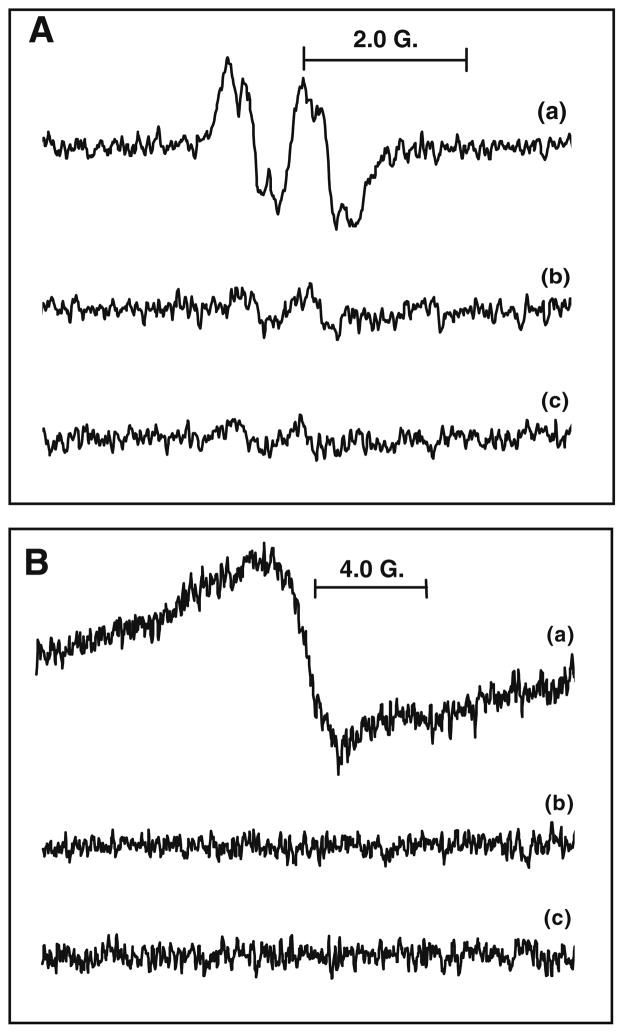
Figure 4.
EPR spectra generated using AAPH. (A) (a) GA (4 mM) and AAPH (15 mM) in PBS solution (pH 7.4) with UV exposure at room temperature (g = 2.0054, ) ; (b) as in (a), but without UV exposure (g = 2.0054); and (c) as in (a), but without AAPH (g = 2.0054). (B) (b) chitosan–GA (24 mM) and AAPH (15 mM) in PBS solution (pH 7.4) with UV exposure at room temperature (g = 2.0055); (b) as in (a), but without UV exposure; and (c) as in (a), but without AAPH.

