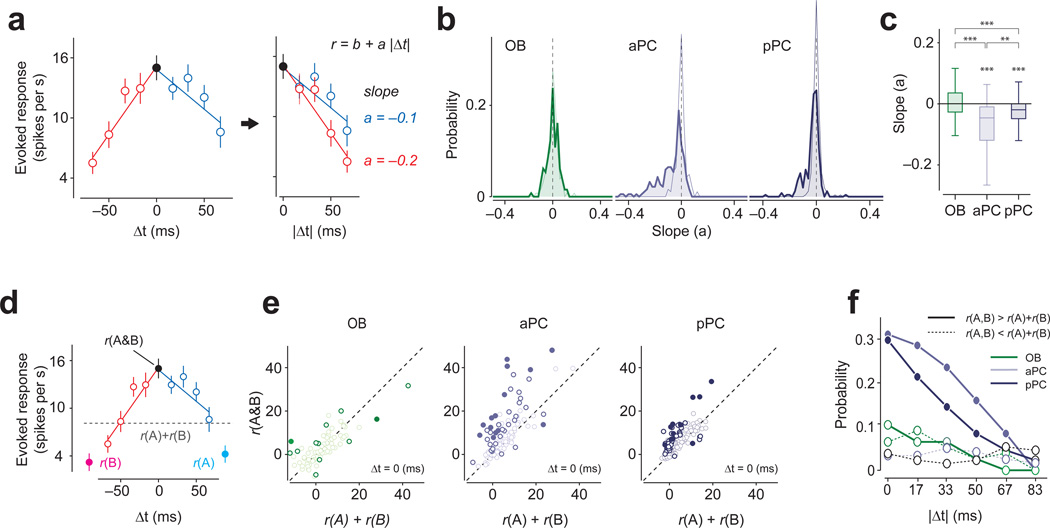
Figure 3. Olfactory bulb and piriform cortex TTC shapes are different.
(a) Analysis of TTCs. For each spot pair, two slopes were obtained by regressing the TTCs at the negative (red) and positive (blue) Δt separately with straight lines (r = b + a|Δt|). The unit of slopes is spikes/s·ms.
(b) Distributions of slopes of TTCs for olfactory bulb, aPC and pPC neurons. Thin lines indicate the distribution of the slopes with the data shuffled with respect to Δts. The distribution of the slopes of the fitted lines was mostly near zero for OBNs (−0.0005 ± 0.5, t-test against zero, t151 = 0.14, P = 0.89, n = 152 fitted lines) whereas aPC and pPC neurons’ slopes were significantly shifted below zero (aPC: −0.069 ± 0.09, t-test against zero, t227 = 11.07, P = 4.6 × 10⁻²³n = 228 fitted lines; pPC: −0.042 ± 0.06, t257 = 9.8, P = 1.0 × 10⁻¹⁹n = 258 fitted lines). The distribution of the slopes for OBNs was similar to those obtained in the surrogate data, suggesting that the variability in slopes originates mostly from the finite number of trials in the data. In contrast, the distribution of the slopes for PCNs was shifted compared to trial-shuffled surrogate data, and the mean slopes were significantly smaller than those of the surrogate data (P < 0.001, Kolmogorov-Smirnov test for both aPC and pPC, n = 228 and 258 fitted lines for pPC and pPC, respectively) whereas that of olfactory bulb (OB) was not (P = 0.63, Kolmogorov-Smirnov test, n = 152 fitted lines).
(c) Box plots of the slopes of TTCs in the three brain regions. The mean slope of aPC and pPC neurons are significantly negative (P < 0.001 for both aPC and pPC t-test against zero). The average slope of OBNs were significantly different from those of aPC and pPC neurons (Z > 6.2, P < 3.5×10⁻¹⁰, for both olfactory bulb versus aPC and olfactory bulb versus pPC, Mann-Whitney U test,) whereas aPC slopes were also significantly different from pPC slopes (Z = −2.82, P = 0.0047, aPC versus pPC, Mann-Whitney U test,). Dashed lines represent the average slope values obtained from trial-shuffled controls in all three brain areas. The vertical line indicates the maximum and minimum values of non-outliers. Points are considered as outliers if they are larger than b +1.5(b−a) or smaller than a −1.5(b−a), where a and b are the 25th and 75th percentiles, respectively. ***, P < 0.001.
(d) An example TTC to illustrate the analysis. r(A), response to A; r(B), response to B; r(A & B), response to simultaneous activation of A and B (Δt = 0). The gray dashed line indicates the arithmetic sum of the response to spot A and B (r(A) + r(B)).
(e) Comparison between the sum of the responses to spots A and B (e.g. r(A) + r(B)) and the actual response for simultaneous presentation of spots A and B (r(A & B), Δt =0). Each circle represents a spot pair. Open and filled dark circles: supralinear facilitation or suppression (P < 0.05, t-test, not corrected (open) or corrected (filled) for multiple comparisons, n = 40 repetitions). In aPC and pPC neurons, the response to r(A & B) tended to be larger than r(A) + r(B).
(f) Percent of spot pairs in which the responses to two-spot stimulations (r(A, B)) were greater than r(A) + r(B) (i.e. supralinear, t-test, P < 0.05, n = 40 repetitions, solid lines) or smaller (sublinear, t-test, P < 0.05, n = 40 repetitions, dashed lines) for a given lag (Δt). The average trial-shuffled control values in all three brain areas resulted in ~3% (range: 1%-8%).

