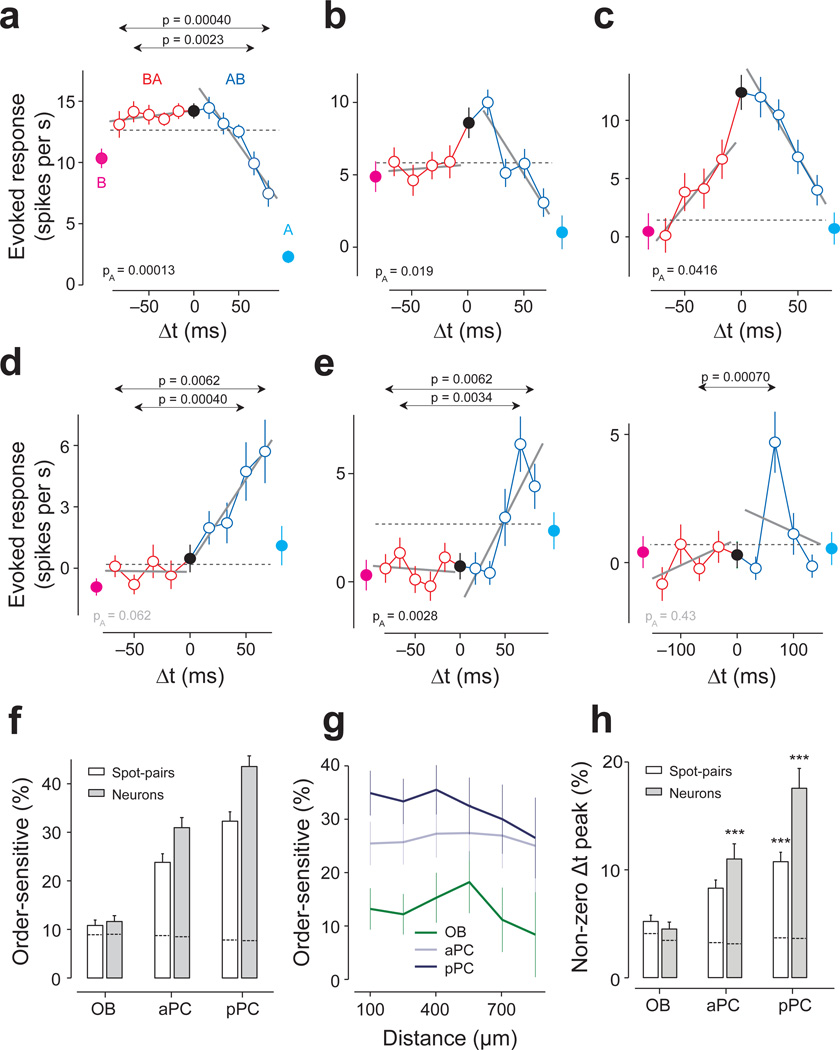
Figure 4. Order-specific responses of PCNs.
(a) TTC of an aPC neuron. Conventions are as in Fig. 2. The responses to B→A stimulation (red) remained flat for all lags, while the response to A→B (blue) decreased as the lag increased. This asymmetry was captured by both the global and lag-specific tests (PA = 0.00013, F1,446 = 14.8, ANCOVA; P = 0.0023, t88 = 3.1, and P = 0.00040, t88 = 3.7, t-test for Δt = ±67 and ±83 ms, respectively, n = 45 repetitions for both). Throughout the figures, PA indicates the p-value in ANCOVA. The p-values for lag-specific comparisons are shown only when they are smaller than the criterion (t-test, corrected for the number of |Δt|’s, Bonferroni correction). Mean ± s.e.m.
(b) TTC of a pPC neuron. The responses to B→A were similar to r(A) + r(B) (the gray dashed line) whereas the response for the opposite order (A→B) decreased as the lag increased. F1,316 = 5.4, PA = 0.019 (ANCOVA, n = 40 repetitions).
(c) TTC of a pPC neuron. The responses to B→A were generally weaker than those to A→B. This asymmetry was captured by the global tests (PA = 0.041, F1,316 = 4.2, ANCOVA). The lag-specific differences at Δt = ±67 and ±50 ms (P = 0.023, t78 = 2.3 and P = 0.025, t78 = 2.3, respectively, t-test, n = 40 repetitions) did not cross the criterion (P < 0.0125; Bonferroni corrected, Supplementary Fig. 5).
(d) TTC of a pPC neuron. This neuron responded maximally when spot B was stimulated 67 ms after spot A (P = 0.0055, t78 = 2.8, t-test between Δt = 67 ms and Δt = 0 ms, n = 40 repetitions) and did not respond to activation of either of the spots nor to simultaneous stimulation of both spots. This asymmetry was captured by the lag-specific test (P = 0.00042, t78 = 3.6 and P = 0.0062, t78 = 2.8 for Δt = ±50 and ±67 ms, respectively, t-test, n = 40 repetitions for both). The global test was not significant (PA = 0.062, F1,316 = 3.5, ANCOVA).
(e) Left, TTC of a pPC neuron. This neuron responded strongly only when A started 50–83 ms after spot B (P = 0.038, 0.00034, 0.0062, t78 = 2.1, t78 = 3.7, t78 = 2.8 for Δt = ±50, ±66 and ±83 ms, respectively, t-test, n = 40 repetitions for all). The responses peaked at 67 ms (P = 0.00099, t78 = 3.4, t-test between Δt = 67 ms and Δt = 0 ms, n = 40 repetitions).Right, TTC of the same neuron as in G1 but tested with a different set of lags in an independent experiment. The peak at Δt = 67 ms was reproduced (P = 0.0027, t78 = 3.1, t-test between Δt = −67 ms and Δt = 0 ms, n = 40 repetitions) but this experiment revealed a decrease of response with longer Δt.
(f) Percentage of order-sensitive cases calculated in terms of spot pairs (white bars) and neurons (gray bars) in each brain area (Bonferonni corrected t-test for all ±Δt and PA < 0.05, ANCOVA, n = 76, 114, 129 spot pairs and n = 45, 46, 63 neurons for olfactory bulb (OB), aPC, and pPC, respectively). Error bars, s.e.m. based on the binomial model. Dashed lines inside the bars represent the FDRs resulting in only ~8% of order-sensitive cases in all three brain areas.
(g) Percentage of order-sensitive responses as a function of the distance between the spots. Error bars, s.e.m. based on the binomial model. The fraction of asymmetric TTCs in piriform cortex did not depend on the distance between the two spots as far as 1 mm on the olfactory bulb surface indicating that order-sensitive temporal interactions occur between glomeruli that are widely distributed in the olfactory bulb. This also indicates that order sensitivity is not due to an artifact caused by activation of adjacent spots through scattered light.
(h) Percentage of cases in which the response to lagged stimulation (either A→B or B→A) was significantly higher than the response to A & B. The results were obtained in terms of the number of spot pairs (white bars) and neurons (gray bars). Error bars, s.e.m. based on the binomial model. Dashed lines inside the bars represent the FDRs. ***, P < 0.001 (binomial test against trial-shuffled controls, n = 76, 114, 129 spot pairs).

