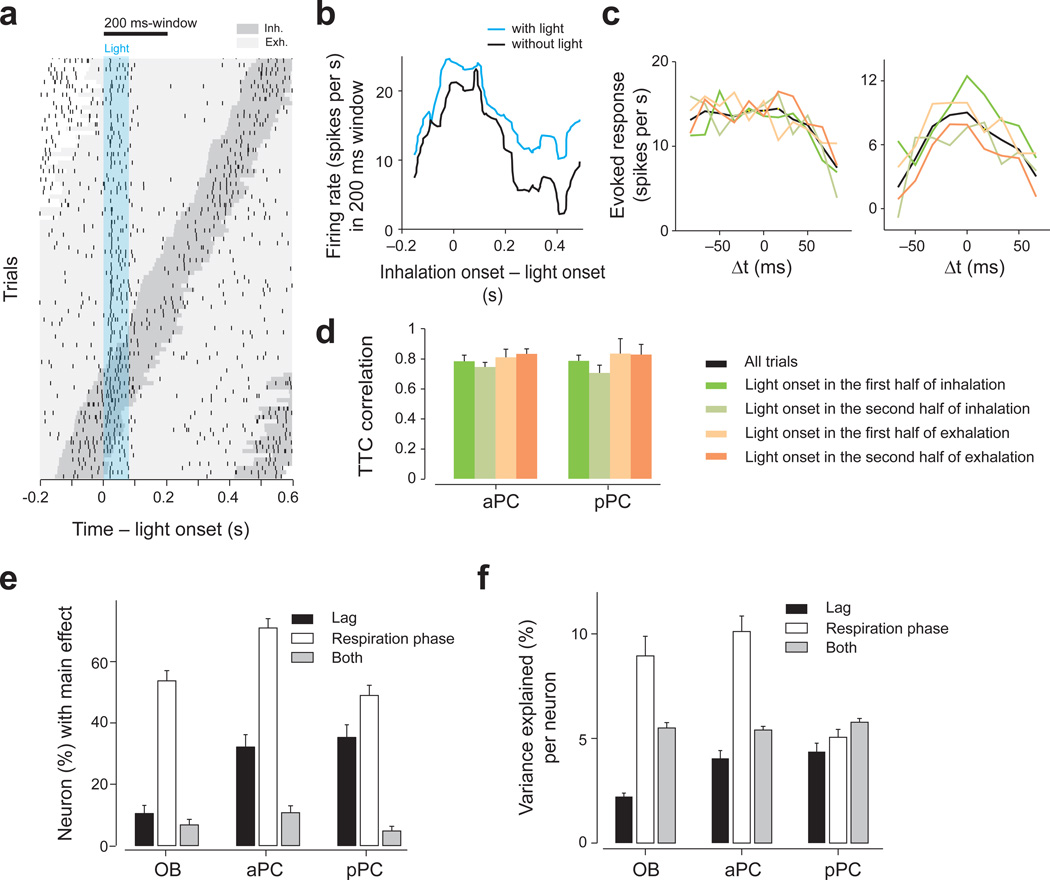
Figure 7. Order-selectivity is largely preserved across different respiration phases.
(a) Raster plot of an M/T cell in response to single spot optical stimulation. Each tick mark represents one spike. The dark gray area indicates inhalation periods and the light gray areas exhalation periods. Trials are sorted by the timing of inhalation onset. The timing of light stimulation (duration: 83 ms) is indicated by the cyan area. This neuron fired preferentially during inhalation periods.
(b) Firing rates in a 200 ms window (indicated at the top of A) as a function of inhalation onset timing relative to light onset (cyan). The data with no light stimulation (black) was obtained by randomly assigning light onset relative to the respiration cycle.
(c) Two examples comparing TTCs at specific respiration phases. The data were parceled into four groups depending on the onset of light stimulation (as indicated in d). Green: trials in which the light started in the first half of the inhalation. Light green: trials in which the light started in the second half of the inhalation. Light orange: trials in which the light started in the first half of the exhalation. Orange: trials in which the light started in the second half of the exhalation. Black: all trials. The shapes of TTCs were similar across the four groups.
(d) Correlation of TTCs. A TTC was obtained for each of the four groups as in c. The correlation between this TTC and the TTC computed with all other trial groups was obtained. The bar graphs show the median correlation across all spot pairs in each brain area. TTCs were obtained only if at least 10 trials were available for all of the four groups. n = 112 and 95 TTCs for aPC and pPC, respectively Mean ± s.d..
(e) Percent of neuron-spot pairs that were modulated by the lag and/or the respiration phase (two-way ANOVA, F3,199 > 2.6 or/and F4,199 > 2.4, P < 0.05, for 4 and 5 Δt, respectively, uncorrected for multiple comparisons. Many neurons were modulated by the respiration phase (white bars). Many neurons in aPC and pPC were modulated by the lag between two spot activations but neurons in olfactory bulb were not (black bars; binomial test, P < 0.001 for both aPC and pPC compared to olfactory bulb [OB]). Error bars: s.e.m. based on the binomial model. The number of TTCs used in the analysis was 134, 224, 190 in the olfactory bulb, aPC and pPC respectively.
(f) The variance of neural responses explained by different factors per neuron (two-way ANOVAs, the average variance explained by the lag, respiration phase or both). Respiration phase explains on average ~10% of the variance in olfactory bulb and aPC. The lag between spot activations explain more of the variance in PCNs than in OBNs (Z = −3.2, P = 0.0011 and Z = −4.3, P = 0.000016 for aPC and pPC compared to olfactory bulb respectively, Mann-Whitney U test). Mean ± s.e.m.. n = 134, 224 and 190 TTCs in the olfactory bulb, aPC and pPC, respectively.

