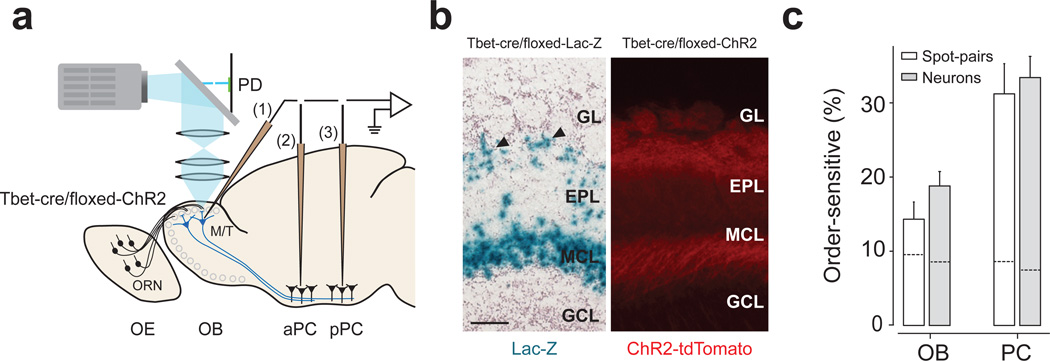
Figure 8. Direct activation of M/T cells produced consistent results.
(a) Experimental design. Conventions are as in Fig. 1a.
(b) Characterization of Tbet-cre/floxed-ChR2 mouse. Left, a section from a Tbet-cre/floxed-Lac-Z mouse. Blue signals (lacZ staining) depict the location of cell bodies. Mitral and tufted cells (arrowheads) are stained. Right, fluorescent image of an olfactory bulb section. Red indicates the location of ChR2 tagged with a red fluorescent protein (tdTomato). Sections from n = 2 and n > 20 mice were examined for lacZ staining and tdTomato fluorescence, respectively. GL: glomerular layer; EPL, external plexiform layer; MCL, mitral cell layer; GRL, granule cell layer. OB, olfactory bulb. Scale bar: 100 µm.
(c) Percentage of order-sensitive responses in olfactory bulb (n = 17 neurons and 28 responding spot pairs) and PCNs (n = 34 neurons and 67 responding spot pairs). The results were obtained in terms of spot pairs (white bars) and neurons (gray bars). The data from aPC and pPC were pooled. Dashed lines inside the bars represent the FDRs.

