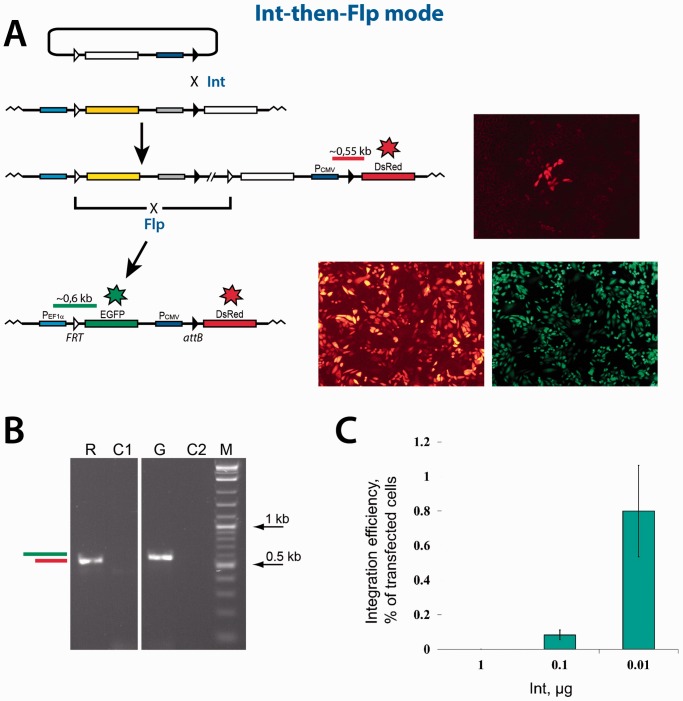
Figure 4.
Sequential dual RMCE reaction in the ‘Int-then-Flp’ mode. (A) Schematics of the reaction. Typical group of red cells formed as a result of the integration reaction mediated by Int, are shown to the right of the respective integration product. The expanded red/green cells formed as a result of the deletion reaction mediated by Flp, are shown to the right of the respective deletion construct. (B) The PCR analyses of typical expanded red and red/green colonies. The horizontal green and red bars in panels (A) and (B) schematically represent the PCR products that are expected if the respective recombination reactions are successful. The sequencing of the PCR products obtained confirmed their identity. R, PCR analysis of the expanded red cells obtained as a result of the Int recombination. C1, control PCR analysis of the cells with the integrated platform reporter using the same primers as in lane ‘R’. G, PCR analysis of the expanded red/green cells obtained as a result of the Flp recombination. C2, control PCR analysis of the red cells obtained as a result of the Int recombination using the same primers as in lane ‘G’. M, 2-log DNA ladder (New England Biolabs). (C) The efficiency of the Int-mediated integration reaction inversely depends on the amount of the Int expression vector added at transfection. The amount of the vector added is indicated. The efficiency of the integration reaction is represented by green bars. The green bars show the mean value of three experiments; the error bars indicate standard deviation.

