
Table 1.
Strand counts and bottom:top strand ratio of siRNA variants, assessed by small RNA deep sequencing, displayed as counts per million
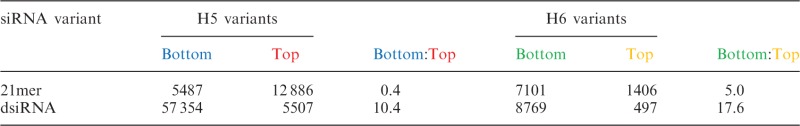 |
Values are the average from n = 3 transfections.
Official websites use .gov
A
.gov website belongs to an official
government organization in the United States.
Secure .gov websites use HTTPS
A lock (
) or https:// means you've safely
connected to the .gov website. Share sensitive
information only on official, secure websites.
Strand counts and bottom:top strand ratio of siRNA variants, assessed by small RNA deep sequencing, displayed as counts per million
|
Values are the average from n = 3 transfections.