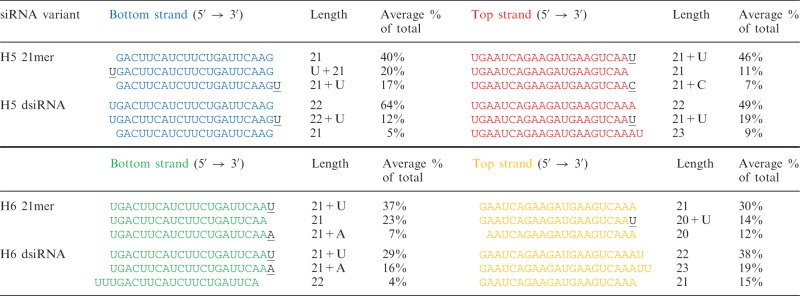
Table 2.
Length and percentage of top three most abundant strand counts for each strand, averaged from triplicate transfections
 |
Underlined letters represent unambiguous untemplated additions.
Length and percentage of top three most abundant strand counts for each strand, averaged from triplicate transfections
 |
Underlined letters represent unambiguous untemplated additions.