
Figure 2.
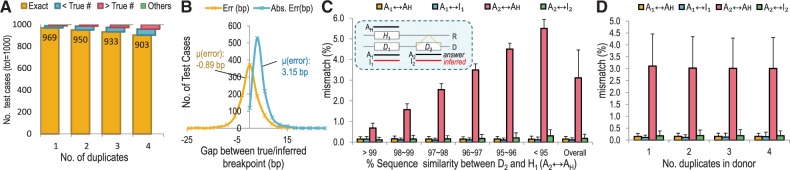
Performance test of Reprever in breakpoint and sequence inference. Totally 1000 simulated genomes are constructed and underwent random duplication up to four copies. (A) Reprever identified up to 97% of the breakpoints. In >90% of four copy insertion cases, Reprever
 exactly found insertion sites. (B) Distribution of error between true/inferred breakpoints. Errors <0 denotes that the inferred breakpoints are located upstream of true breakpoints, errors >0 denotes downstream. The average error size is 3.15 bp. (C) Accuracy of reconstructed duplicate sequences in 969 test genomes. Comparisons between the true and inferred sequences (
 ) are measured in sequence dissimilarity using BLAST. Compared with the reference sequence AH, which is the best estimate sequence for extra copies without reconstruction, Reprever
 -inferred sequences have much less mismatches to the true answers (green bars). The performance is consistent regardless of initial diversity among duplicons (red bars). (D) Reprever
 can reconstruct multiple duplicates simultaneously without an accuracy loss.