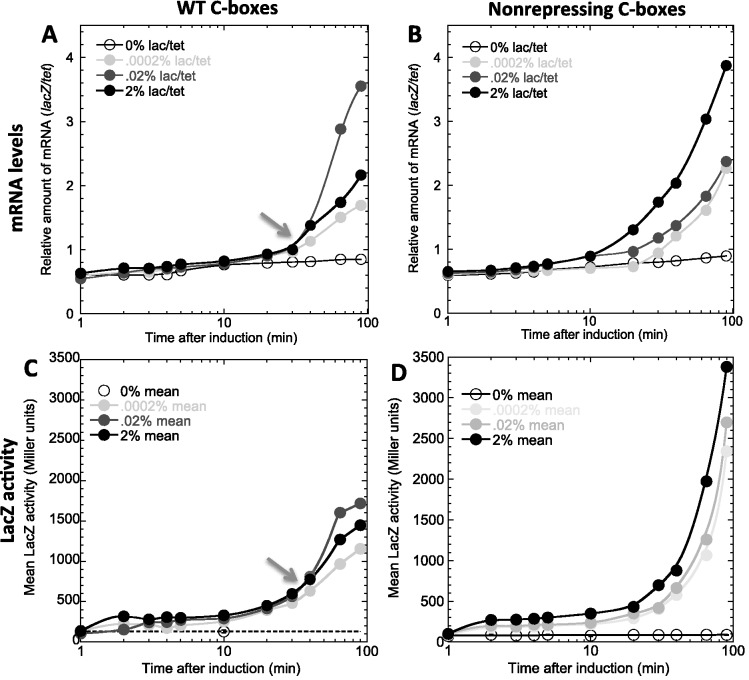
Figure 4.
Temporal response of PpvuIICR to inductions of PvuIIC. Top (A, B) shows lacZ mRNA levels measured by QRT-PCR; bottom (C, D) shows β-galactosidase activities. Left (A, C) is with the WT PpvuIICR2 promoter; right (B, D) is the non-repressing variant altered in OR. The arrows indicate crossover points, at which a higher inducer level results in lower responses. Such crossovers are absent in titrations using the non-repressing mutant.

