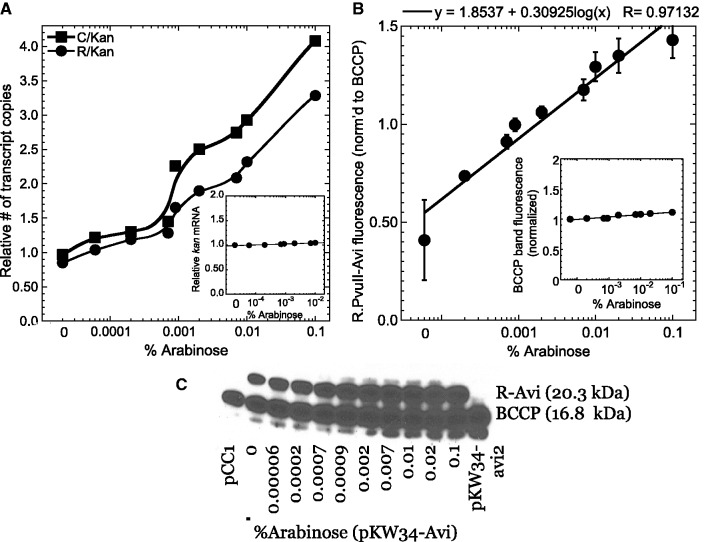
Figure 7.
PvuII gene expression in response to gene copy number. (A) Transcriptional responses. Reverse transcript QRT-PCR was used to determine the levels of the mRNAs for the Control protein (C, squares), and REase (R, circles) relative to that for kan (inset, normalized to total RNA). The experiment was carried out as described in Figure 6. (B, C) Translational responses. Panel (B) shows densitometry of triplicate western blots (mean ± SE) such as the one shown in panel (C). Note that panel (C) is taken from a film image exposed to maximize visibility, while the quantitation is from luminescence densitometry. The PvuII REase (R) includes a carboxyl-terminal Avi tag (55), that is biotinylated in vivo. Levels were normalized to BCCP, the one E. coli K-12 protein that is naturally biotinylated (inset in panel (B), relative to constant total protein). Panel (C), probed with streptavidin-HRP, indicates the positions of size markers (left), and two control extracts from the vector pCC1 (only BCCP is labeled) and pKW34-avi2 [only BCCP and MTase (latter not included in section of blot shown) are labeled].

