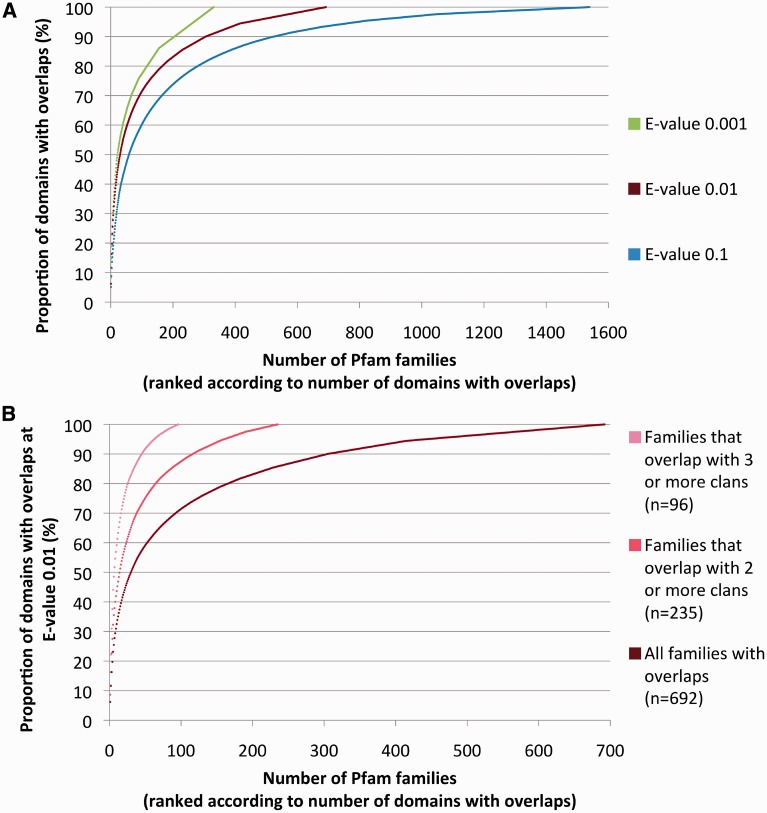
Figure 2.
(A) Cumulative proportion of overlapping domains in Pfam families. Families are ranked according to the number of their domains that overlap (in descending order) after applying a winner-takes-all greedy algorithm that assigns overlapping domains to families (see ‘Materials and Methods’ section). Data shown for three E-value significance thresholds. (B) Same as 2A red line, with additional plots for families that overlap with two or more, and three or more clans only (E-value = 0.01).

