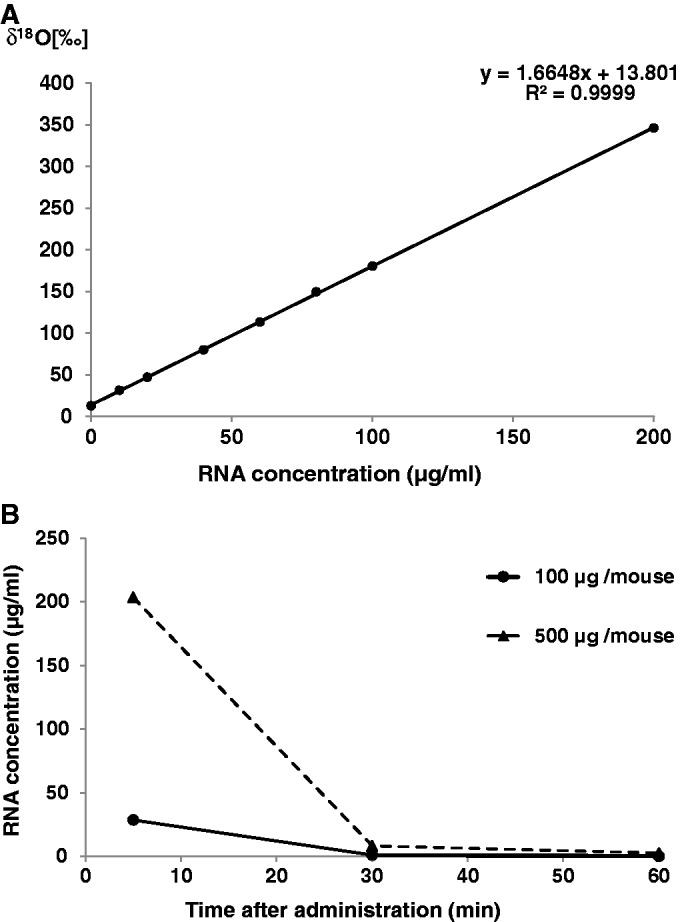
Figure 3.

Determination of siRNA in the blood of mice after intravenous administration. (A) 18O/16O isotope ratio as a function of 18O-labeled control siRNA concentration. δ18O values were calculated from the results of IRMS, and the concentration of 18O-labeled control siRNA in the plasma was determined by its absorbance at 260 nm. Each value is the average of at least three independent experiments. (B) Blood concentration-time curve of control siRNA. The RNA concentrations were calculated from the δ18O values of the plasma samples. Each value is the average of at least three independent experiments.
