Figure 4.
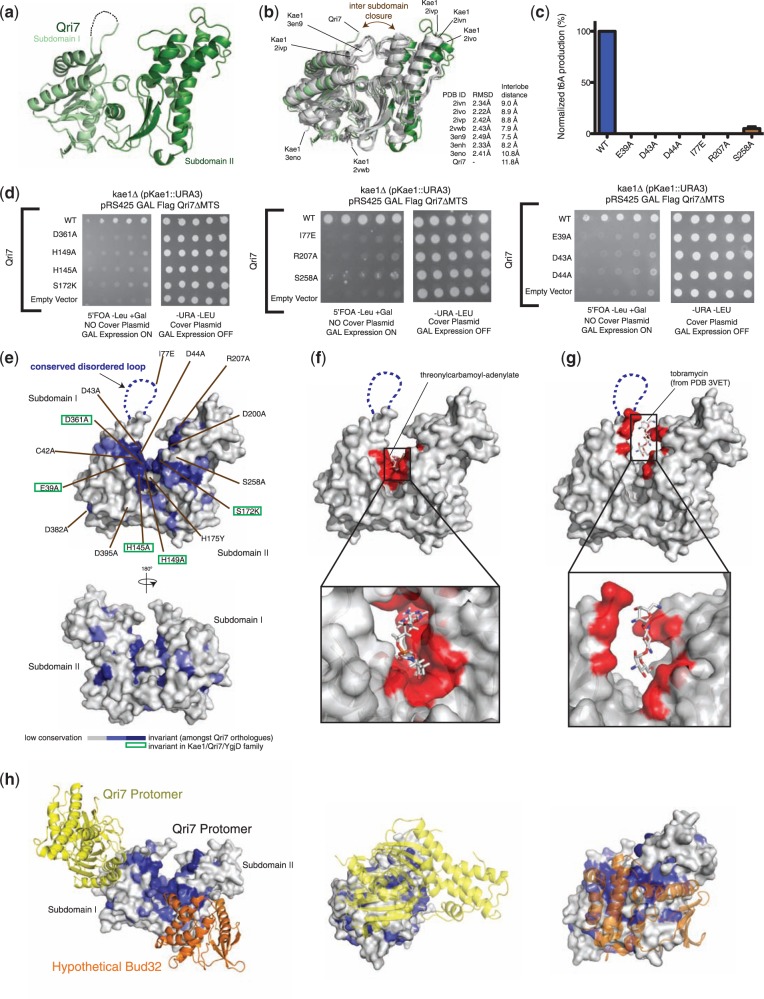
Structure–function analysis of Qri7. (a) Structure of Saccharomyces cerevisiae Qri7 (amino acids 30–407) shown in ribbons representation. Subdomains I and II are shown in light green and dark green, respectively. (b) Structural alignment of scQri7 (green) with all structures of Kae1 solved to date (grey), shown as ribbon representations. RMSDs of Qri7 relative to each Kae1 structure and the intersubdomain distances representing degree of lobe closure are listed. Intersubdomain distances were measured by the distance between Cα atoms of two conserved glycine residues (G117 and G174 in Qri7) on either side of the catalytic cleft. (c) Mutation of catalytic cleft residues on Qri7 abolishes t6A biosynthesis. Error bars represent s.d. (n = 2). (d) Mutation of catalytic cleft residues on Qri7 abolishes its ability to rescue the kae1Δ slow growth phenotype. (e) Projection of conservation onto a surface representation of Qri7. Residues in the catalytic cleft region are labeled and invariant residues across the Kae1/Qri7/YgjD family are boxed in green. (f) Docking of TCA into the catalytic cleft of Qri7. Qri7 catalytic cleft residues in close contact (<5 Å separation) with the docked TCA are shown in red. (g) Modeled tobramycin in the catalytic cleft of Qri7. Residues in close contact (<5 Å separation) with the modeled tobramycin molecule are shown in red. (h) Surface conservation of the Qri7 dimerization interface and hypothetical Bud32 binding site. The second Qri7 protomer in the dimer is shown in yellow ribbon and Bud32 is shown in orange ribbon (left panel). Head-on view of the Qri7 homodimer interface (middle panel) and head-on view of the hypothetical Bud32 binding site on Qri7 (right panel).

