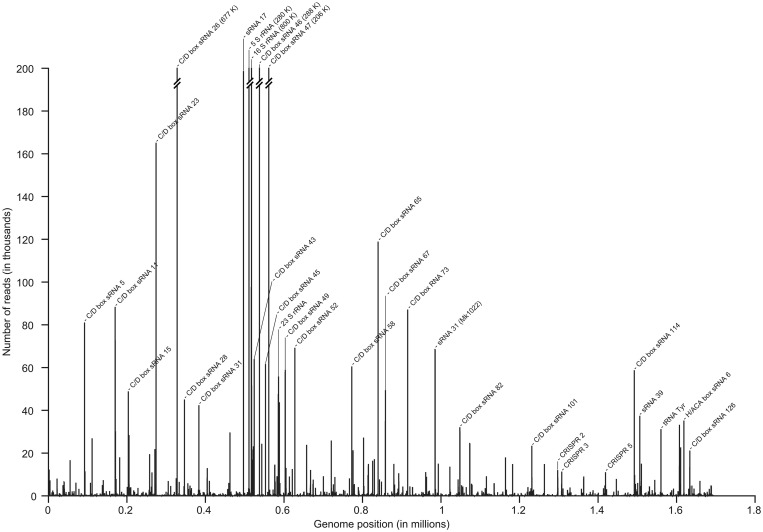
Figure 1.
The sRNome of M. kandleri. The overview graph illustrates the genome-wide coverage of Illumina HiSeq2000 reads mapped to the M. kandleri AV19 genome (Genbank: NC_003551, 1694969 bp). Prominent peaks were analyzed at single-nucleotide resolution, and abundant sRNAs (e.g. C/D box sRNAs) were identified. For peaks that cover over 200 000 reads, the number of reads is given in brackets.

